Risk Assessment Examples
This section provides practical examples of plots of land evaluated using Open Atlas Vantage-X risk assessment API. Each example demonstrates the risk levels — High, Medium, and Low — and includes accompanying visualizations, explanations, and plot details.
High-Risk Assessment Example
Plot Details
- Location: Indonesia, West Sumatra
- Commodity: Palm Oil
- Harvest Date: 2024-12-15
- Plot Size: 21.11 hectares
Risk Assessment Results
- Risk Level: High
- Risk Reason: High: Deforestation > 15% or > 1 ha
- Total Deforestation Area: 16.74 hectares
- Deforestation Percentage: 79.33%
Plot Data Example
{
  "plot_name": "High Risk Plot Example",
  "geojson": {
    "type": "FeatureCollection",
    "features": [
      {
        "type": "Feature",
        "geometry": {
          "type": "Polygon",
          "coordinates": [
            [
              [101.03019769419808, -2.248583087627925],
              [101.028618565927047, -2.250660556750697],
              [101.031432250731328, -2.255540452512117],
              [101.034060493033039, -2.253646094855585],
              [101.03019769419808, -2.248583087627925]
            ]
          ]
        }
      }
    ]
  },
  "commodity": "palm_oil",
  "harvest_date": "2024-12-15"
}
Visualisation
The image below is the risk assessment visualisation highlighting a high-risk palm oil plot showing significant deforestation (red) as of 2024-12-15.
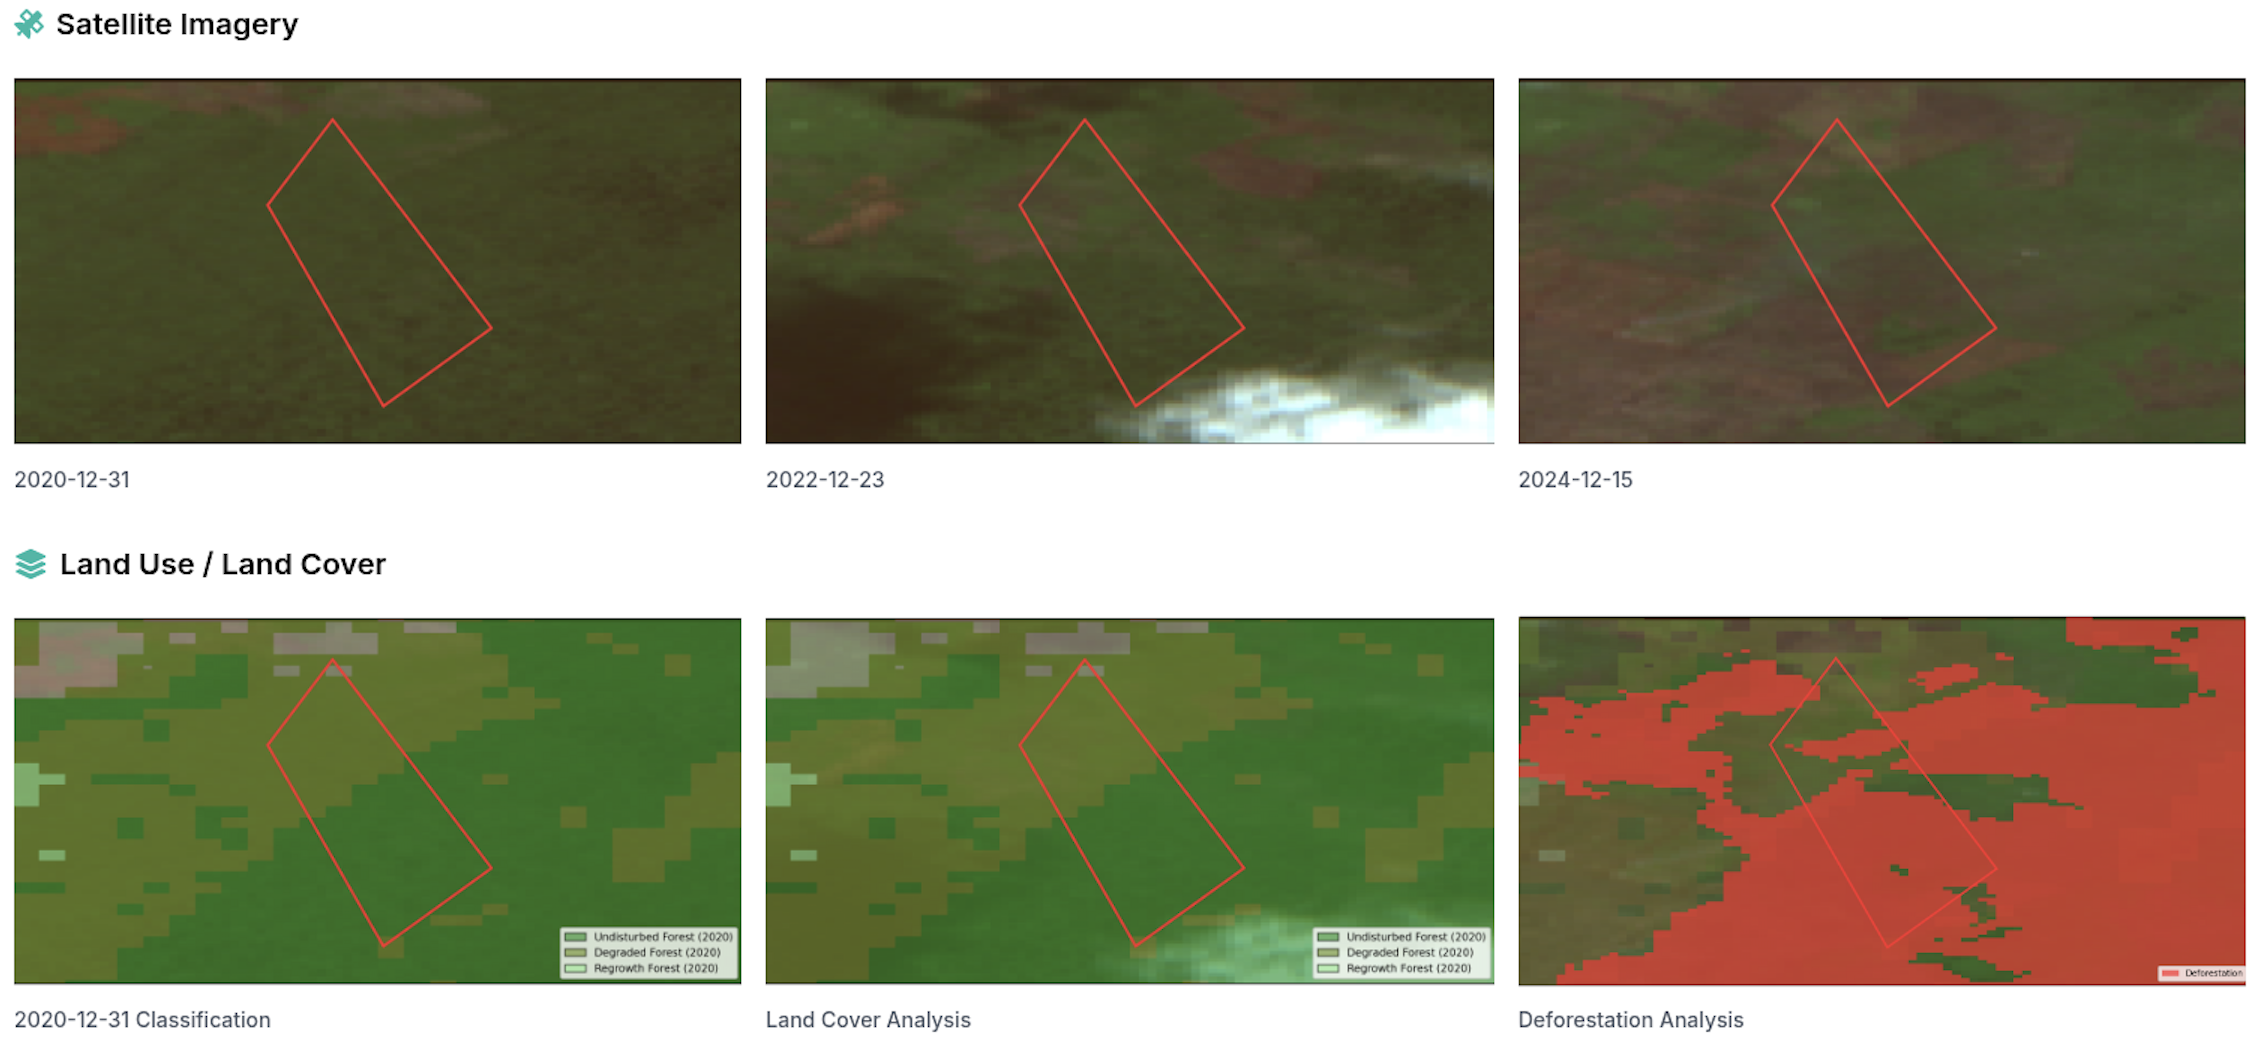
The entire visualisation is available here.
Medium-Risk Assessment Example
Plot Details
- Location: Indonesia, Riau
- Commodity: Palm Oil
- Harvest Date: 2024-12-15
- Plot Size: 16.39 hectares
Risk Assessment Results
- Risk Level: Medium
- Risk Reason: Medium: Deforestation > 10% or > 0.5 ha
- Total Deforestation Area: 0.74 hectares
- Deforestation Percentage: 4.51%
Plot Data Example
{
  "plot_name": "Medium Risk Plot Example",
  "geojson": {
    "type": "FeatureCollection",
    "features": [
      {
        "type": "Feature",
        "geometry": {
          "type": "Polygon",
          "coordinates": [
            [
              [101.52149185325538, 1.377032605597716],
              [101.52277641437439, 1.374763007579887],
              [101.52703573049133, 1.377174141641101],
              [101.52609782424352, 1.379631039020687],
              [101.52149185325538, 1.377032605597716]
            ]
          ]
        }
      }
    ]
  },
  "commodity": "palm_oil",
  "harvest_date": "2024-12-15"
}
Visualisation
The image below is the risk assessment visualisation highlighting a medium-risk palm oil plot showing some level of deforestation (red) as of 2024-12-15.
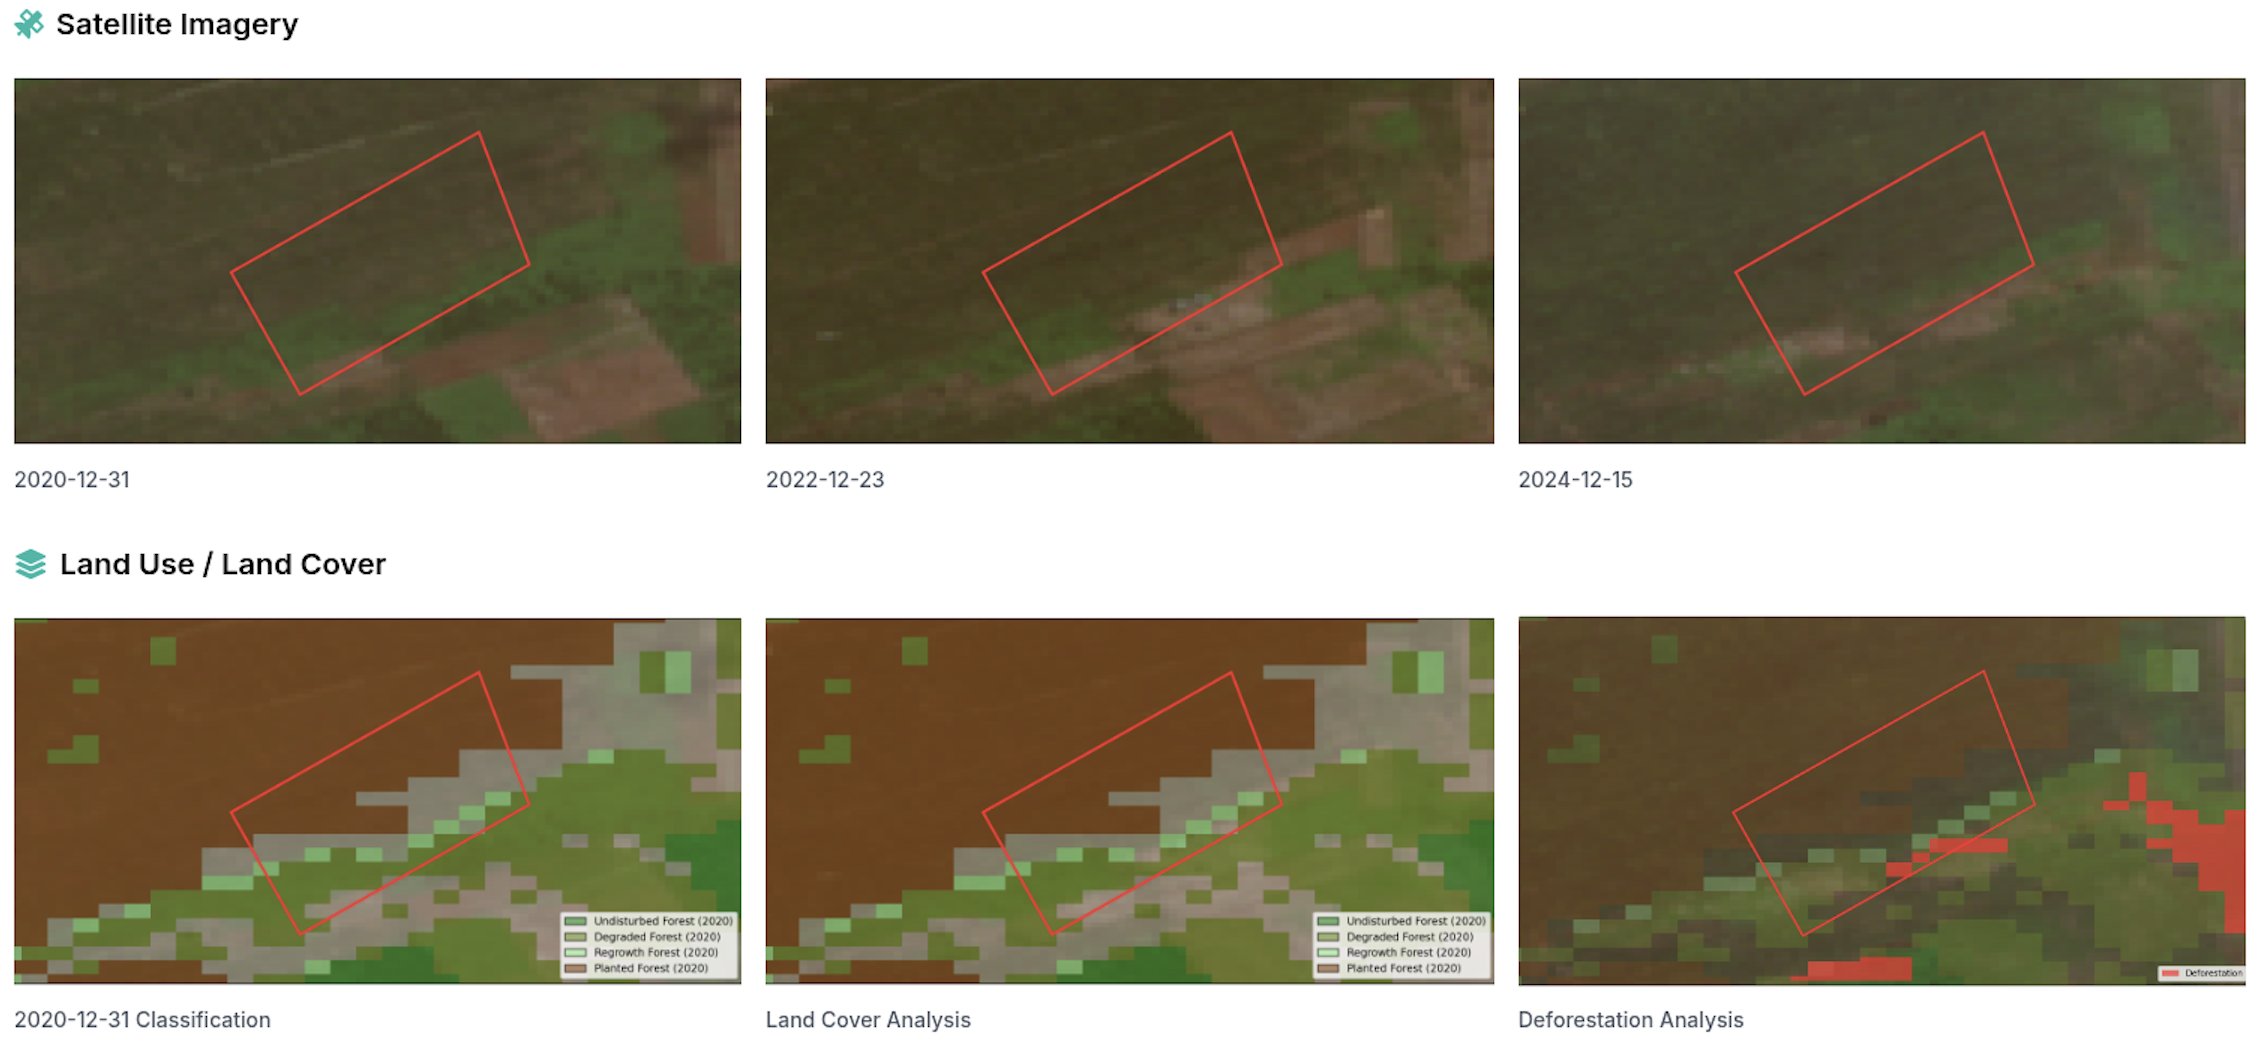
The entire visualisation is available here.
Low-Risk Assessment Example
Plot Details
- Location: Indonesia, South Sumatra
- Commodity: Palm Oil
- Harvest Date: 2024-12-15
- Plot Size: 18.70 hectares
Risk Assessment Results
- Risk Level: Low
- Risk Reason: Low: Low deforestation, low forest area
- Total Deforestation Area: 0.0 hectares
- Deforestation Percentage: 0.0%
Plot Data Example
{
  "plot_name": "Low Risk Plot Example",
  "geojson": {
    "type": "FeatureCollection",
    "features": [
      {
        "type": "Feature",
        "geometry": {
          "type": "Polygon",
          "coordinates": [
            [
              [104.92522863211003, -2.889078155033891],
              [104.92503595057855, -2.891146343365671],
              [104.93240031886911, -2.891258570395936],
              [104.93221196917735, -2.889114401997282],
              [104.92522863211003, -2.889078155033891]
            ]
          ]
        }
      }
    ]
  },
  "commodity": "palm_oil",
  "harvest_date": "2024-12-15"
}
Visualisation
The image below is the risk assessment visualisation highlighting a low-risk palm oil plot showing that the whole area has been a planted forest.
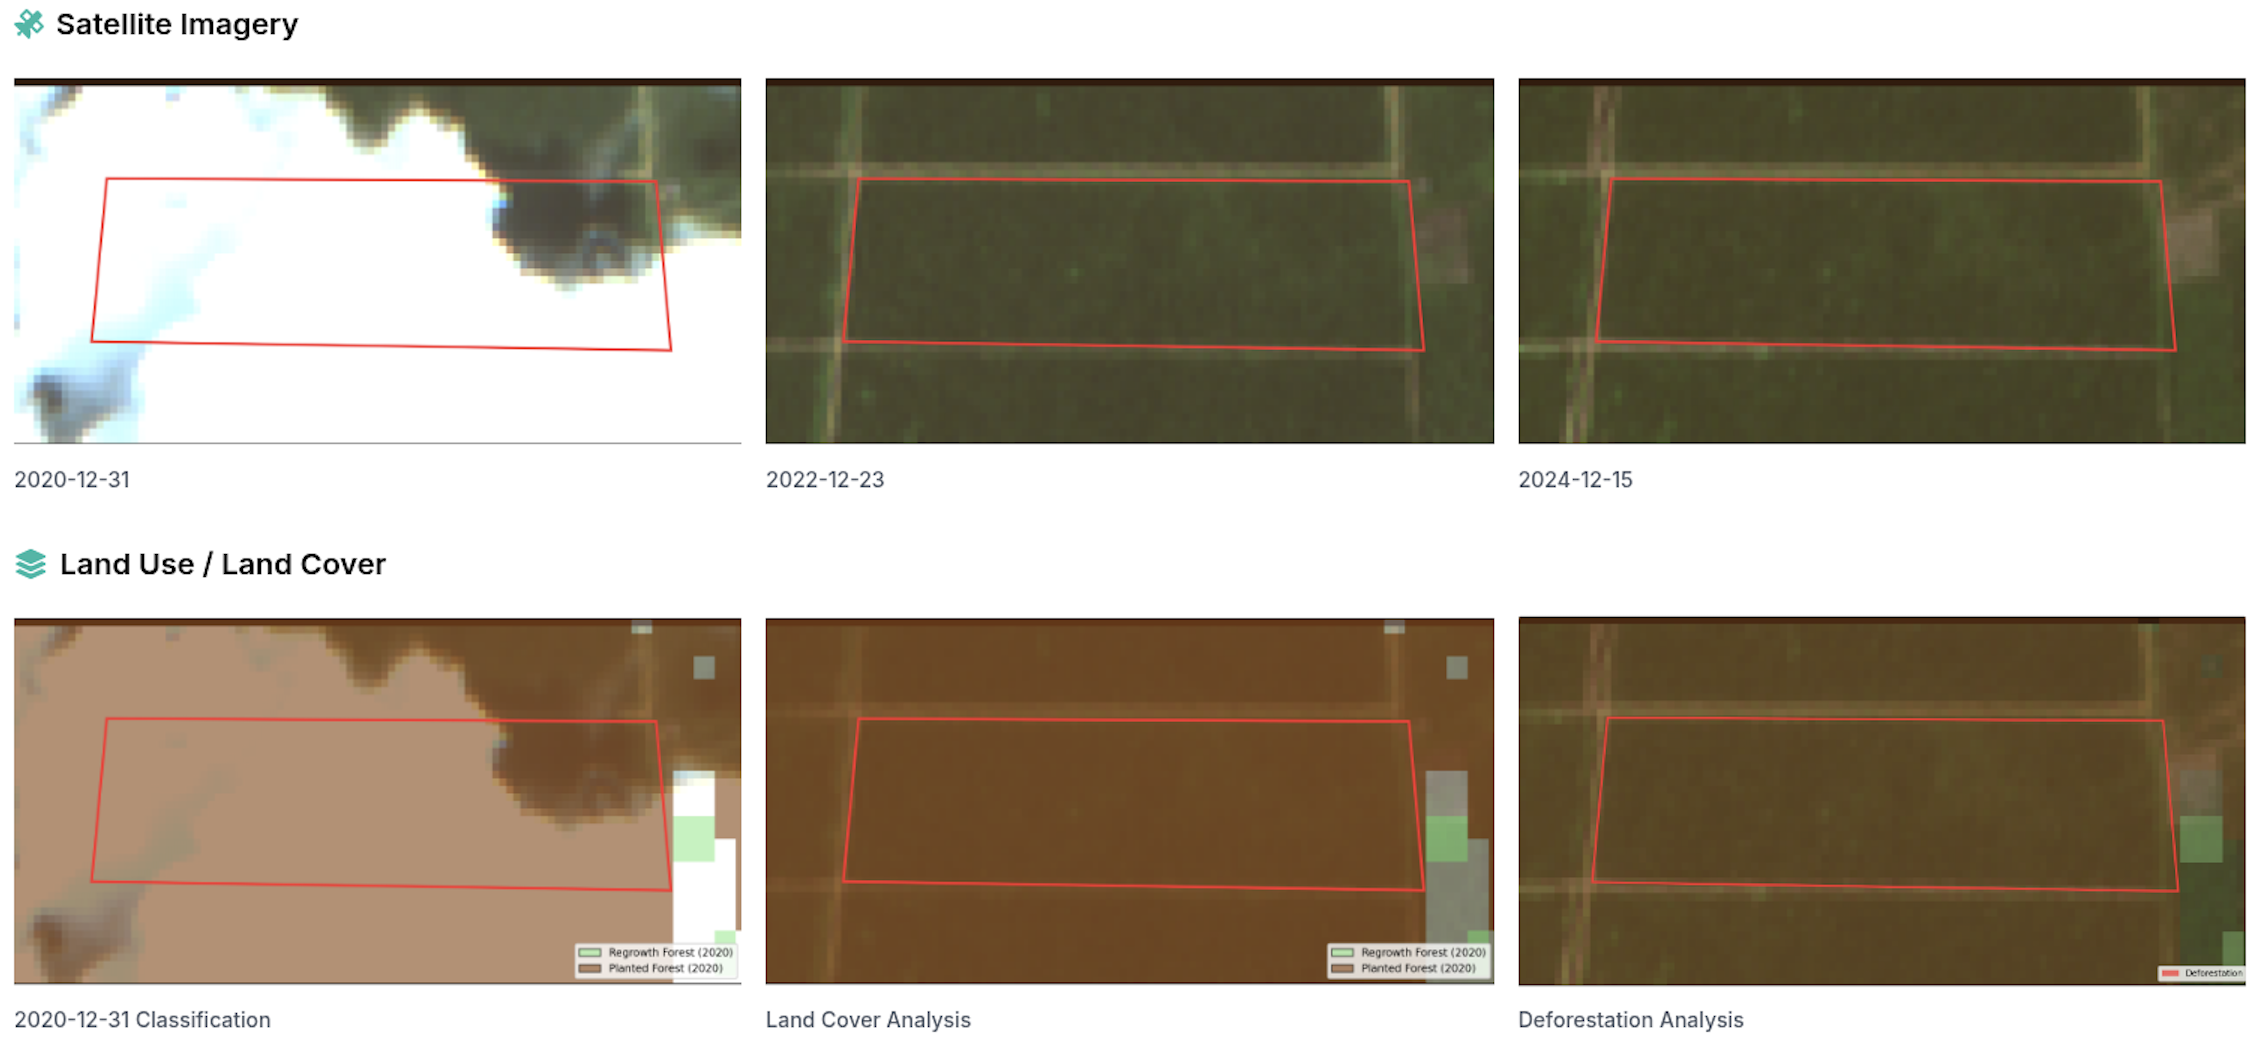
The entire visualisation is available here.
Next Steps
To perform a risk assessment for your plots, follow our Risk Assessment Tutorial or refer to the API Reference Documentation for detailed instructions.