Visualisation
Vantage produces visual outputs for EUDR analysis so reviewers can inspect the evidence behind each risk result. Visual outputs are available through generated artifacts in the API and surfaced in the app where users review plot-level results.
General Information
The visualisation summarizes the analyzed plot and result:
- Plot identifier and location.
- Area in hectares.
- Commodity.
- Risk level and risk reason.
- Assessment date.
- Analysis cutoff or harvest date.
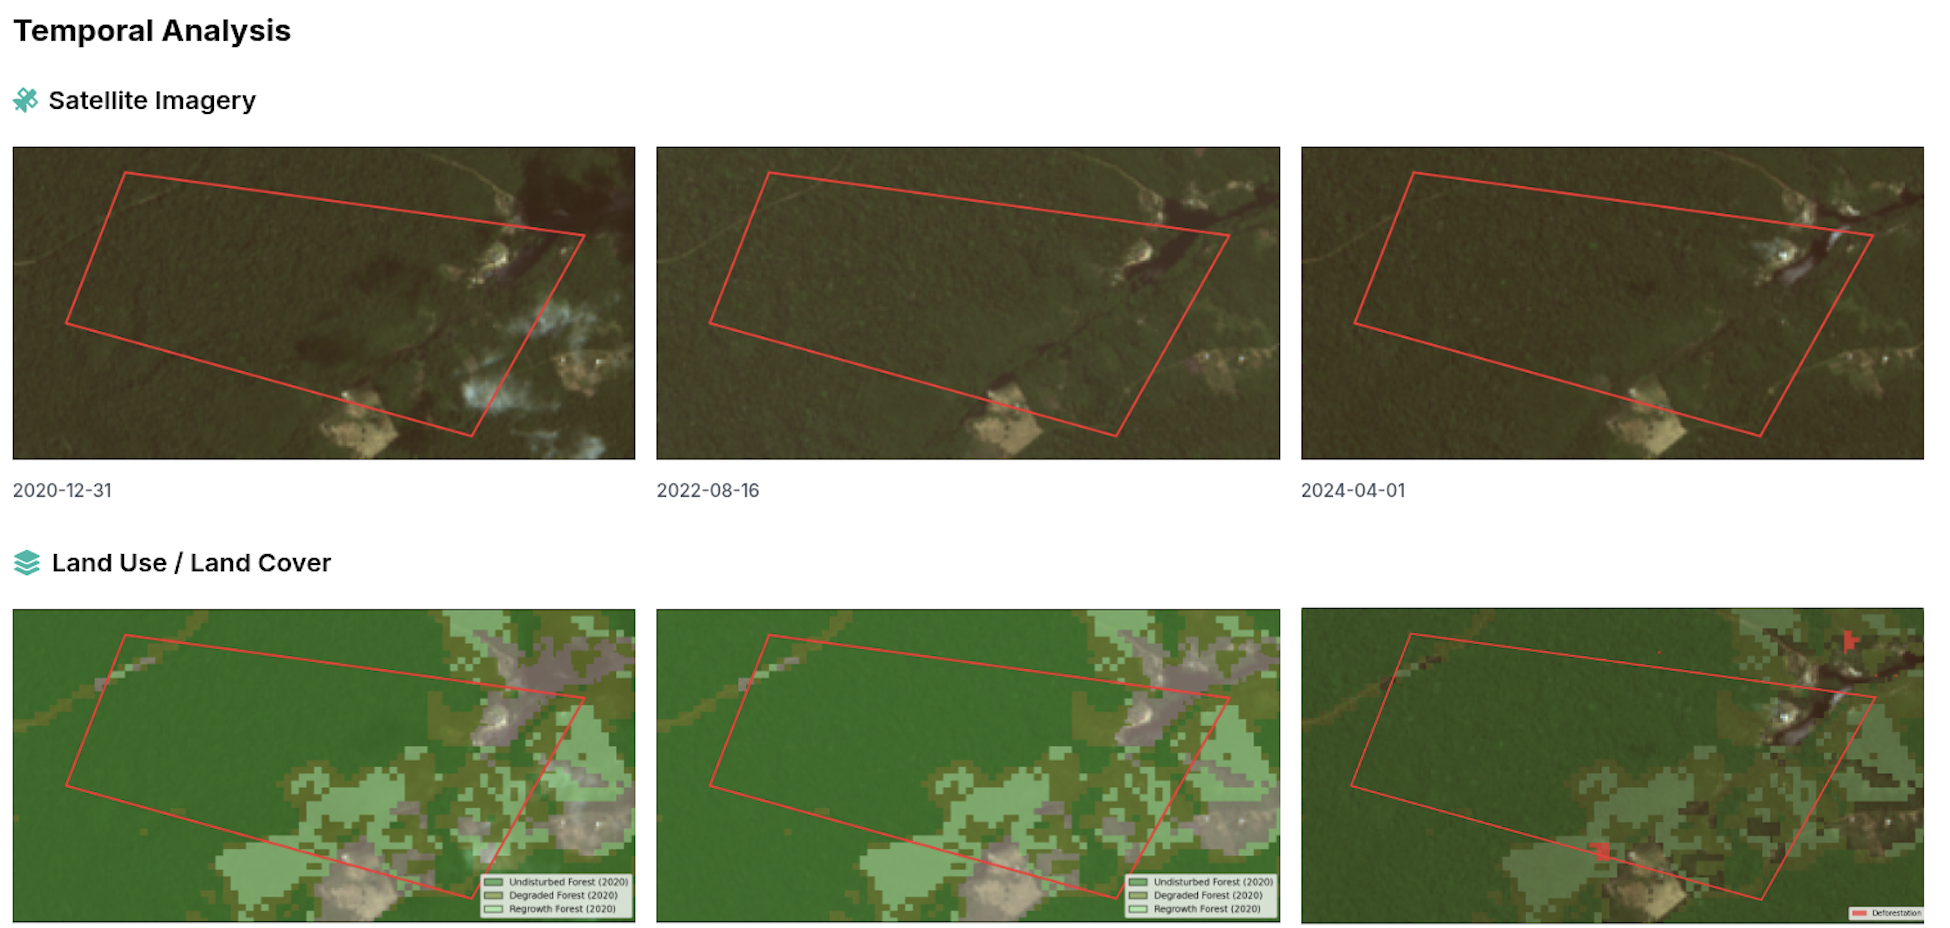
Temporal Analysis
The temporal section compares satellite imagery and land-cover classes across the analysis period. It helps reviewers understand whether land-use change occurred after the EUDR baseline.
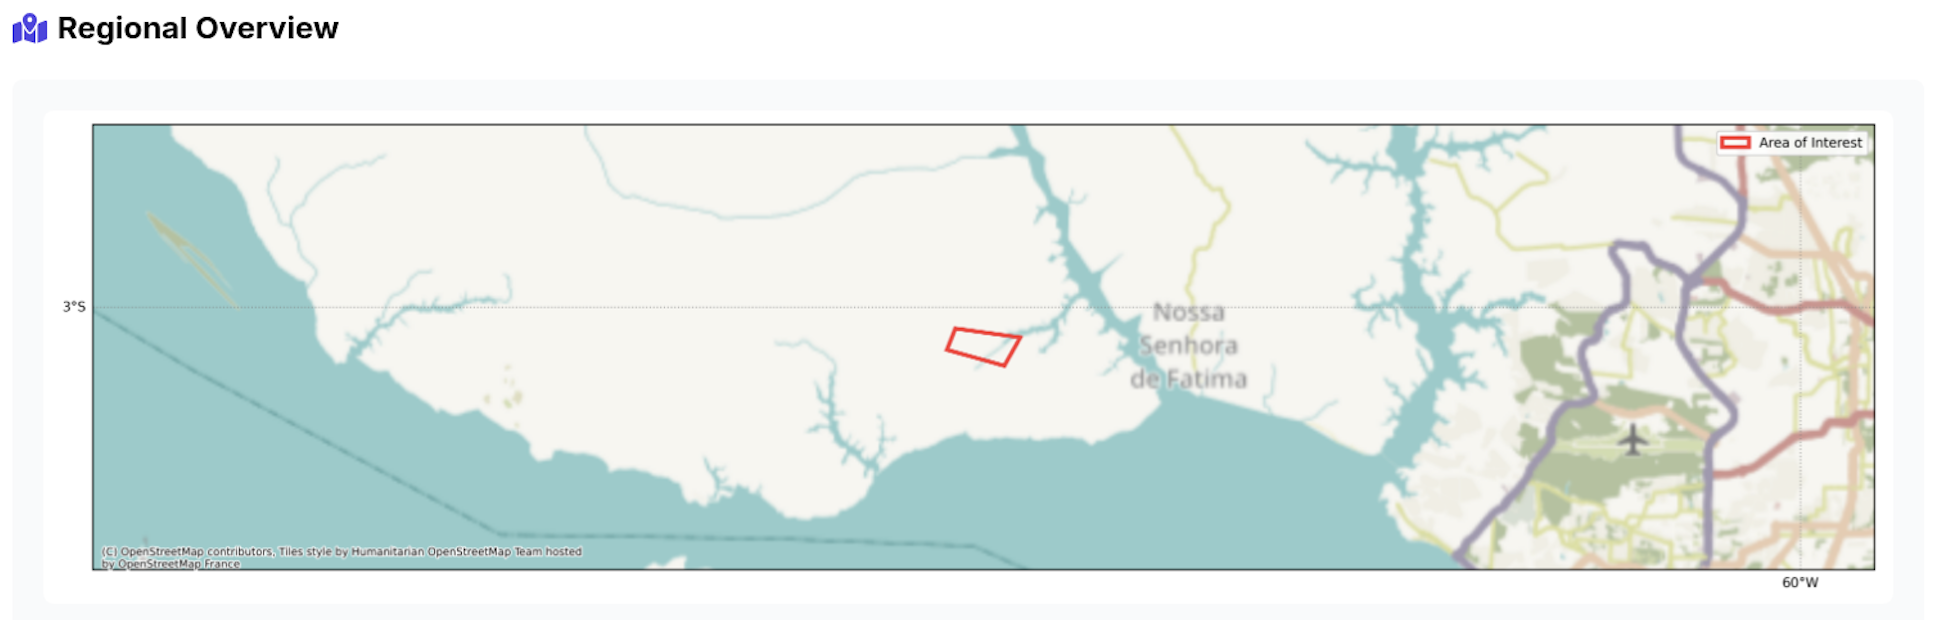
Regional Overview
The regional overview places the plot in geographic context, with a map view of the plot location and surrounding administrative or natural features.
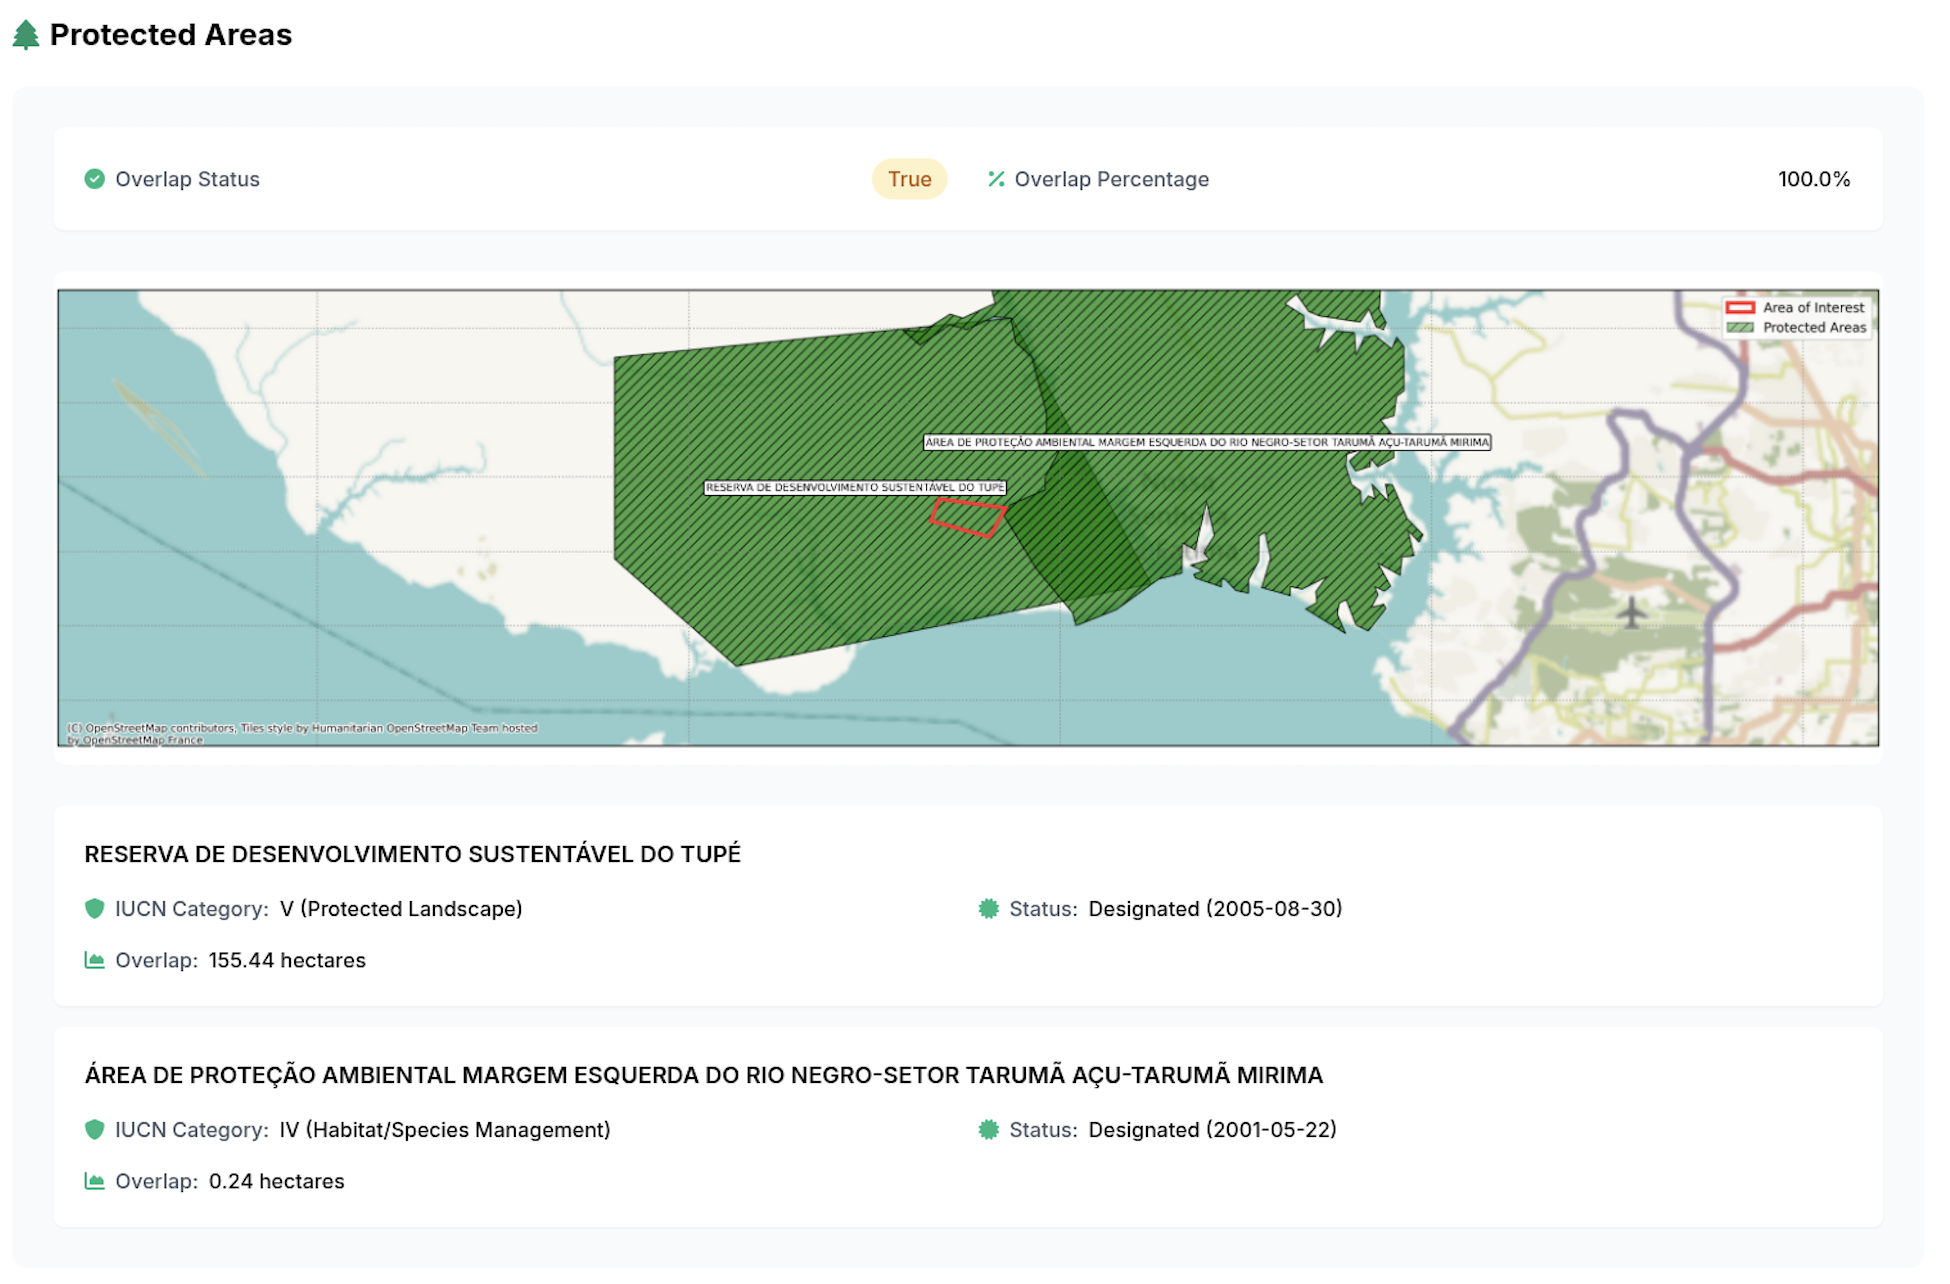
Protected Areas
The protected areas view shows whether the plot intersects with protected area boundaries and summarizes overlap area and percentage.
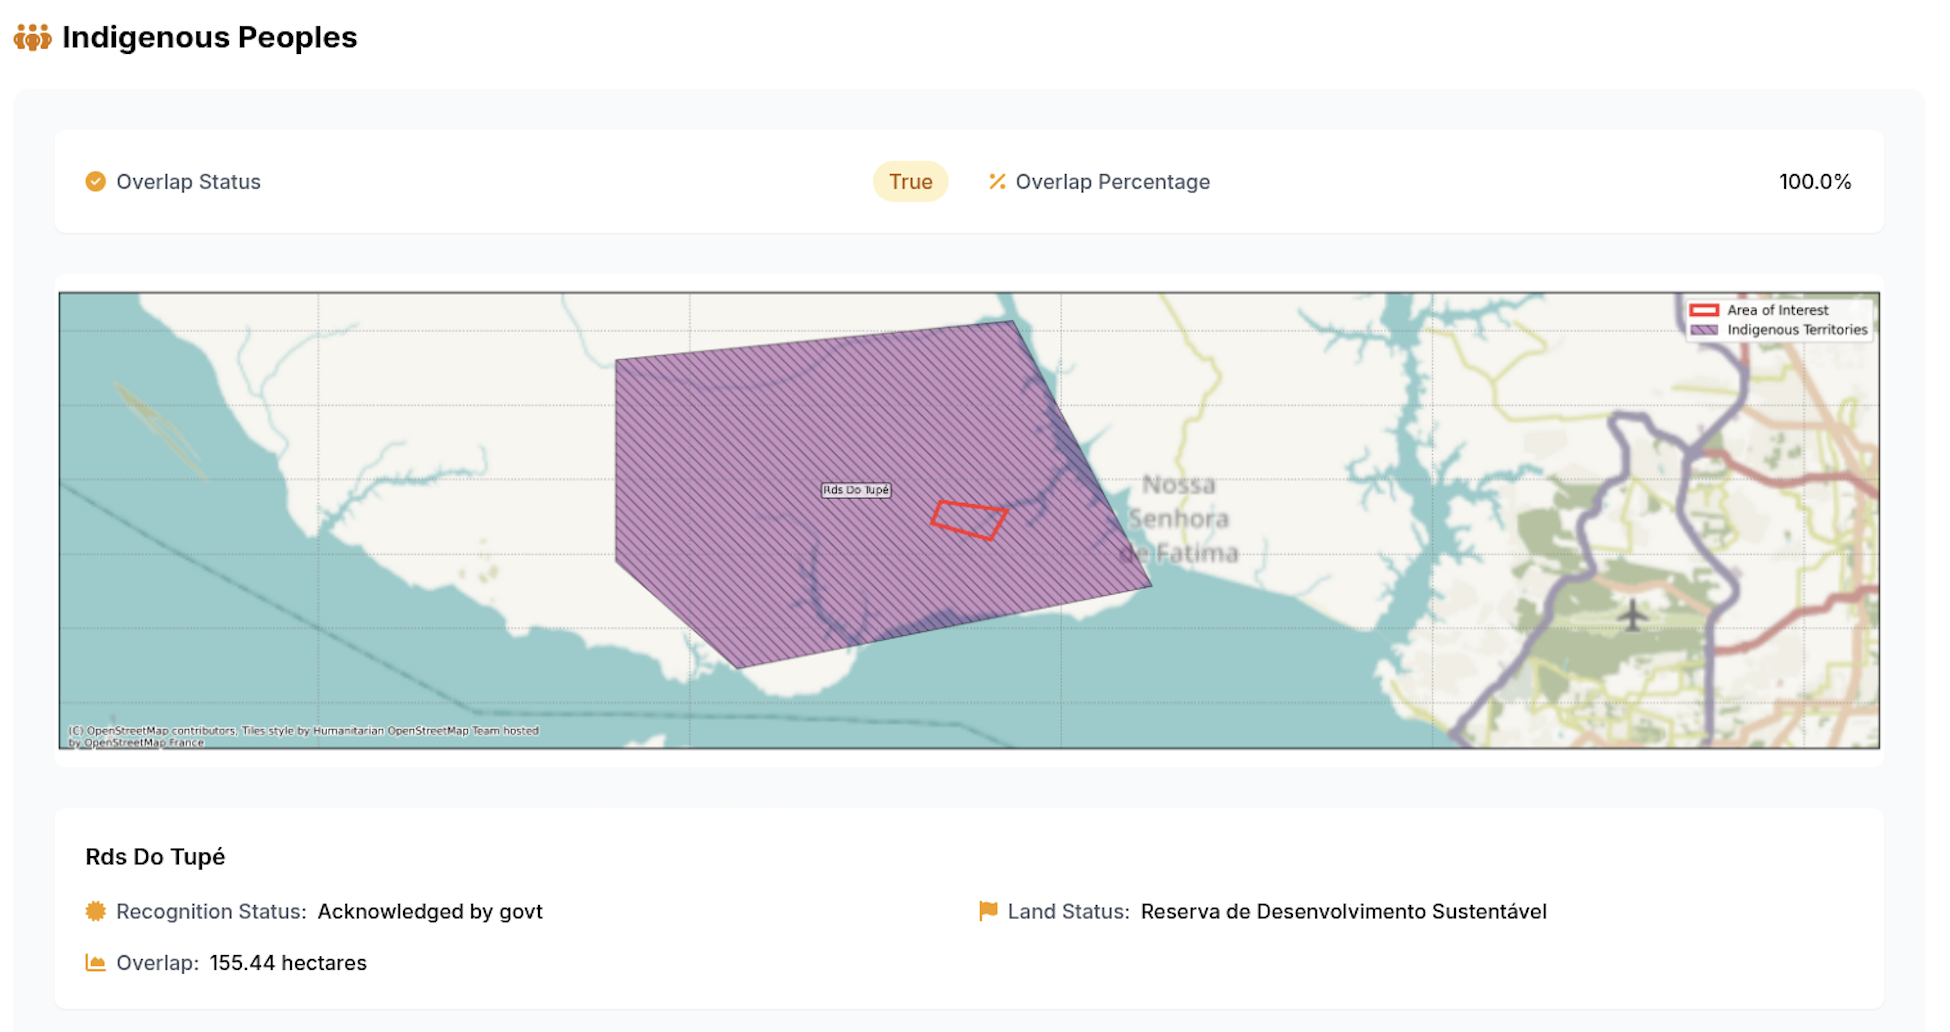
Indigenous Lands
The Indigenous lands view shows whether the plot intersects with Indigenous territories or lands included in the available source datasets.
Example Output
You can download the full visualisation example here.