Vantage App Tutorial
This tutorial walks through the main Vantage app workflow: sign in, open a project, add plots, run analyses, review results, and export data.
Sign in
Sign in to the Vantage app with your OpenAtlas account. Your workspace shows the projects, plots, API access, billing, and token balance available to your user.
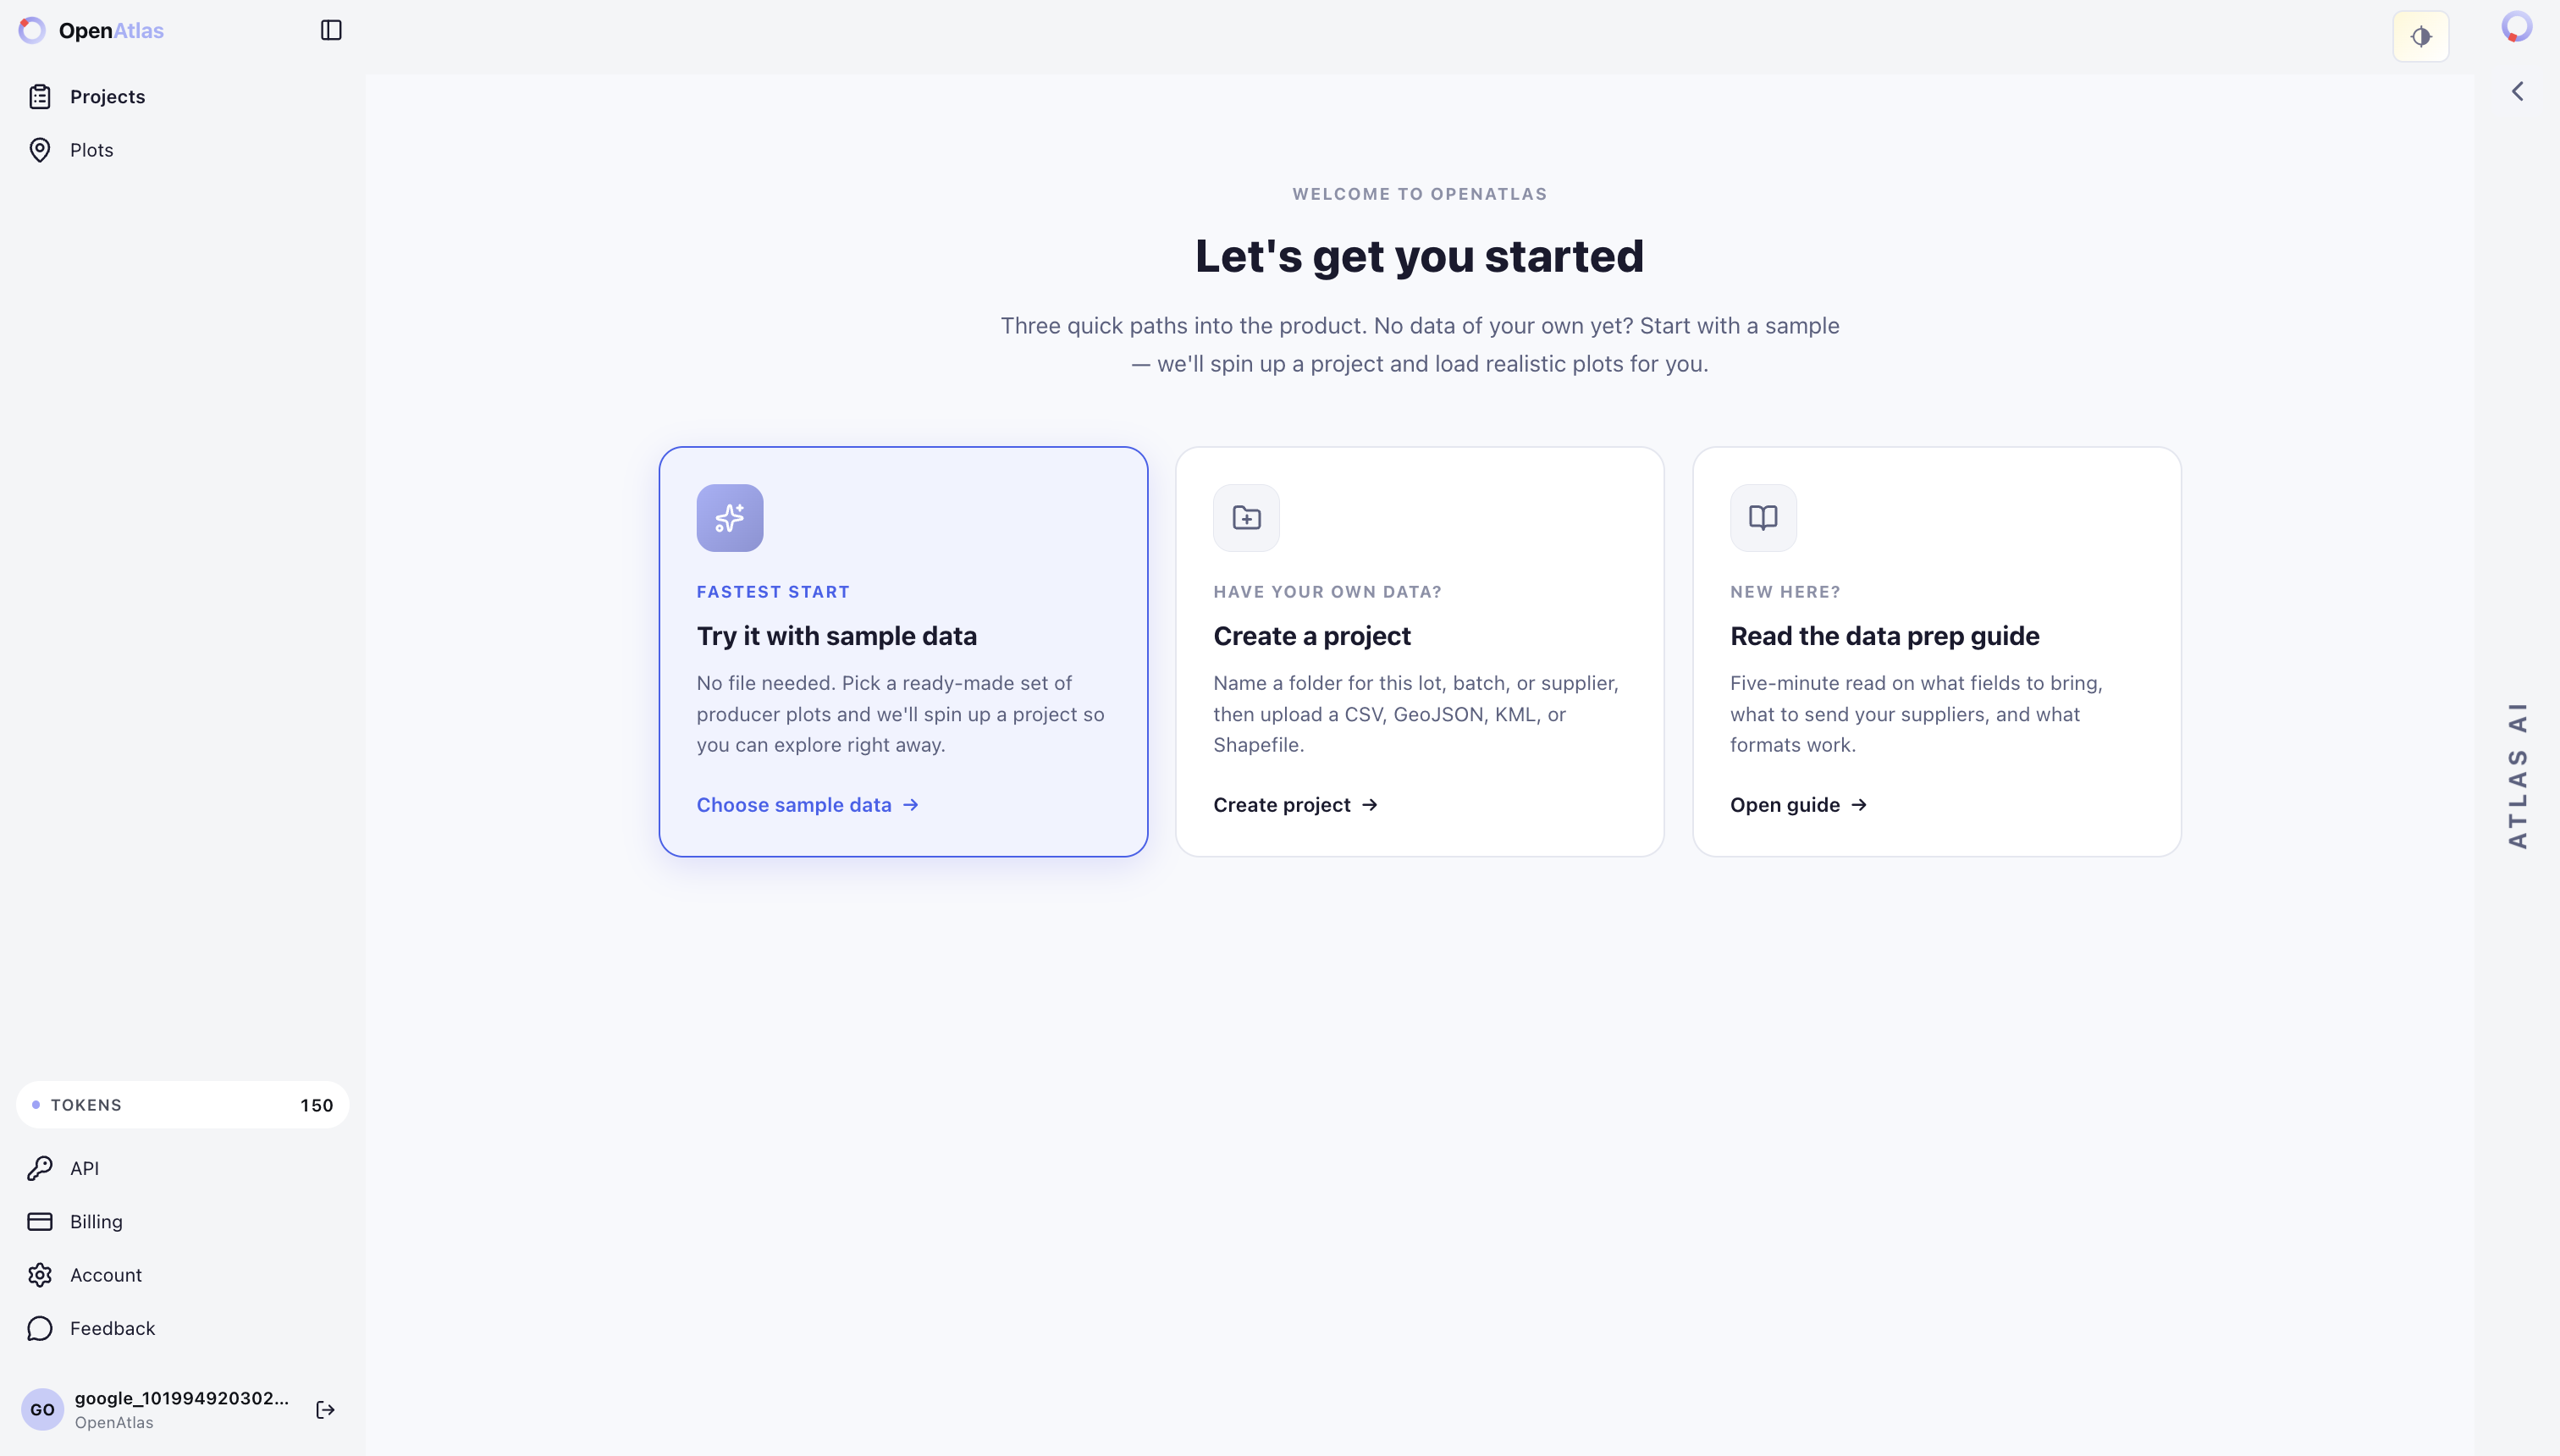
Open a project
Projects group plots and analysis results. Use projects to keep supplier portfolios, commodity samples, or operational review batches organized.
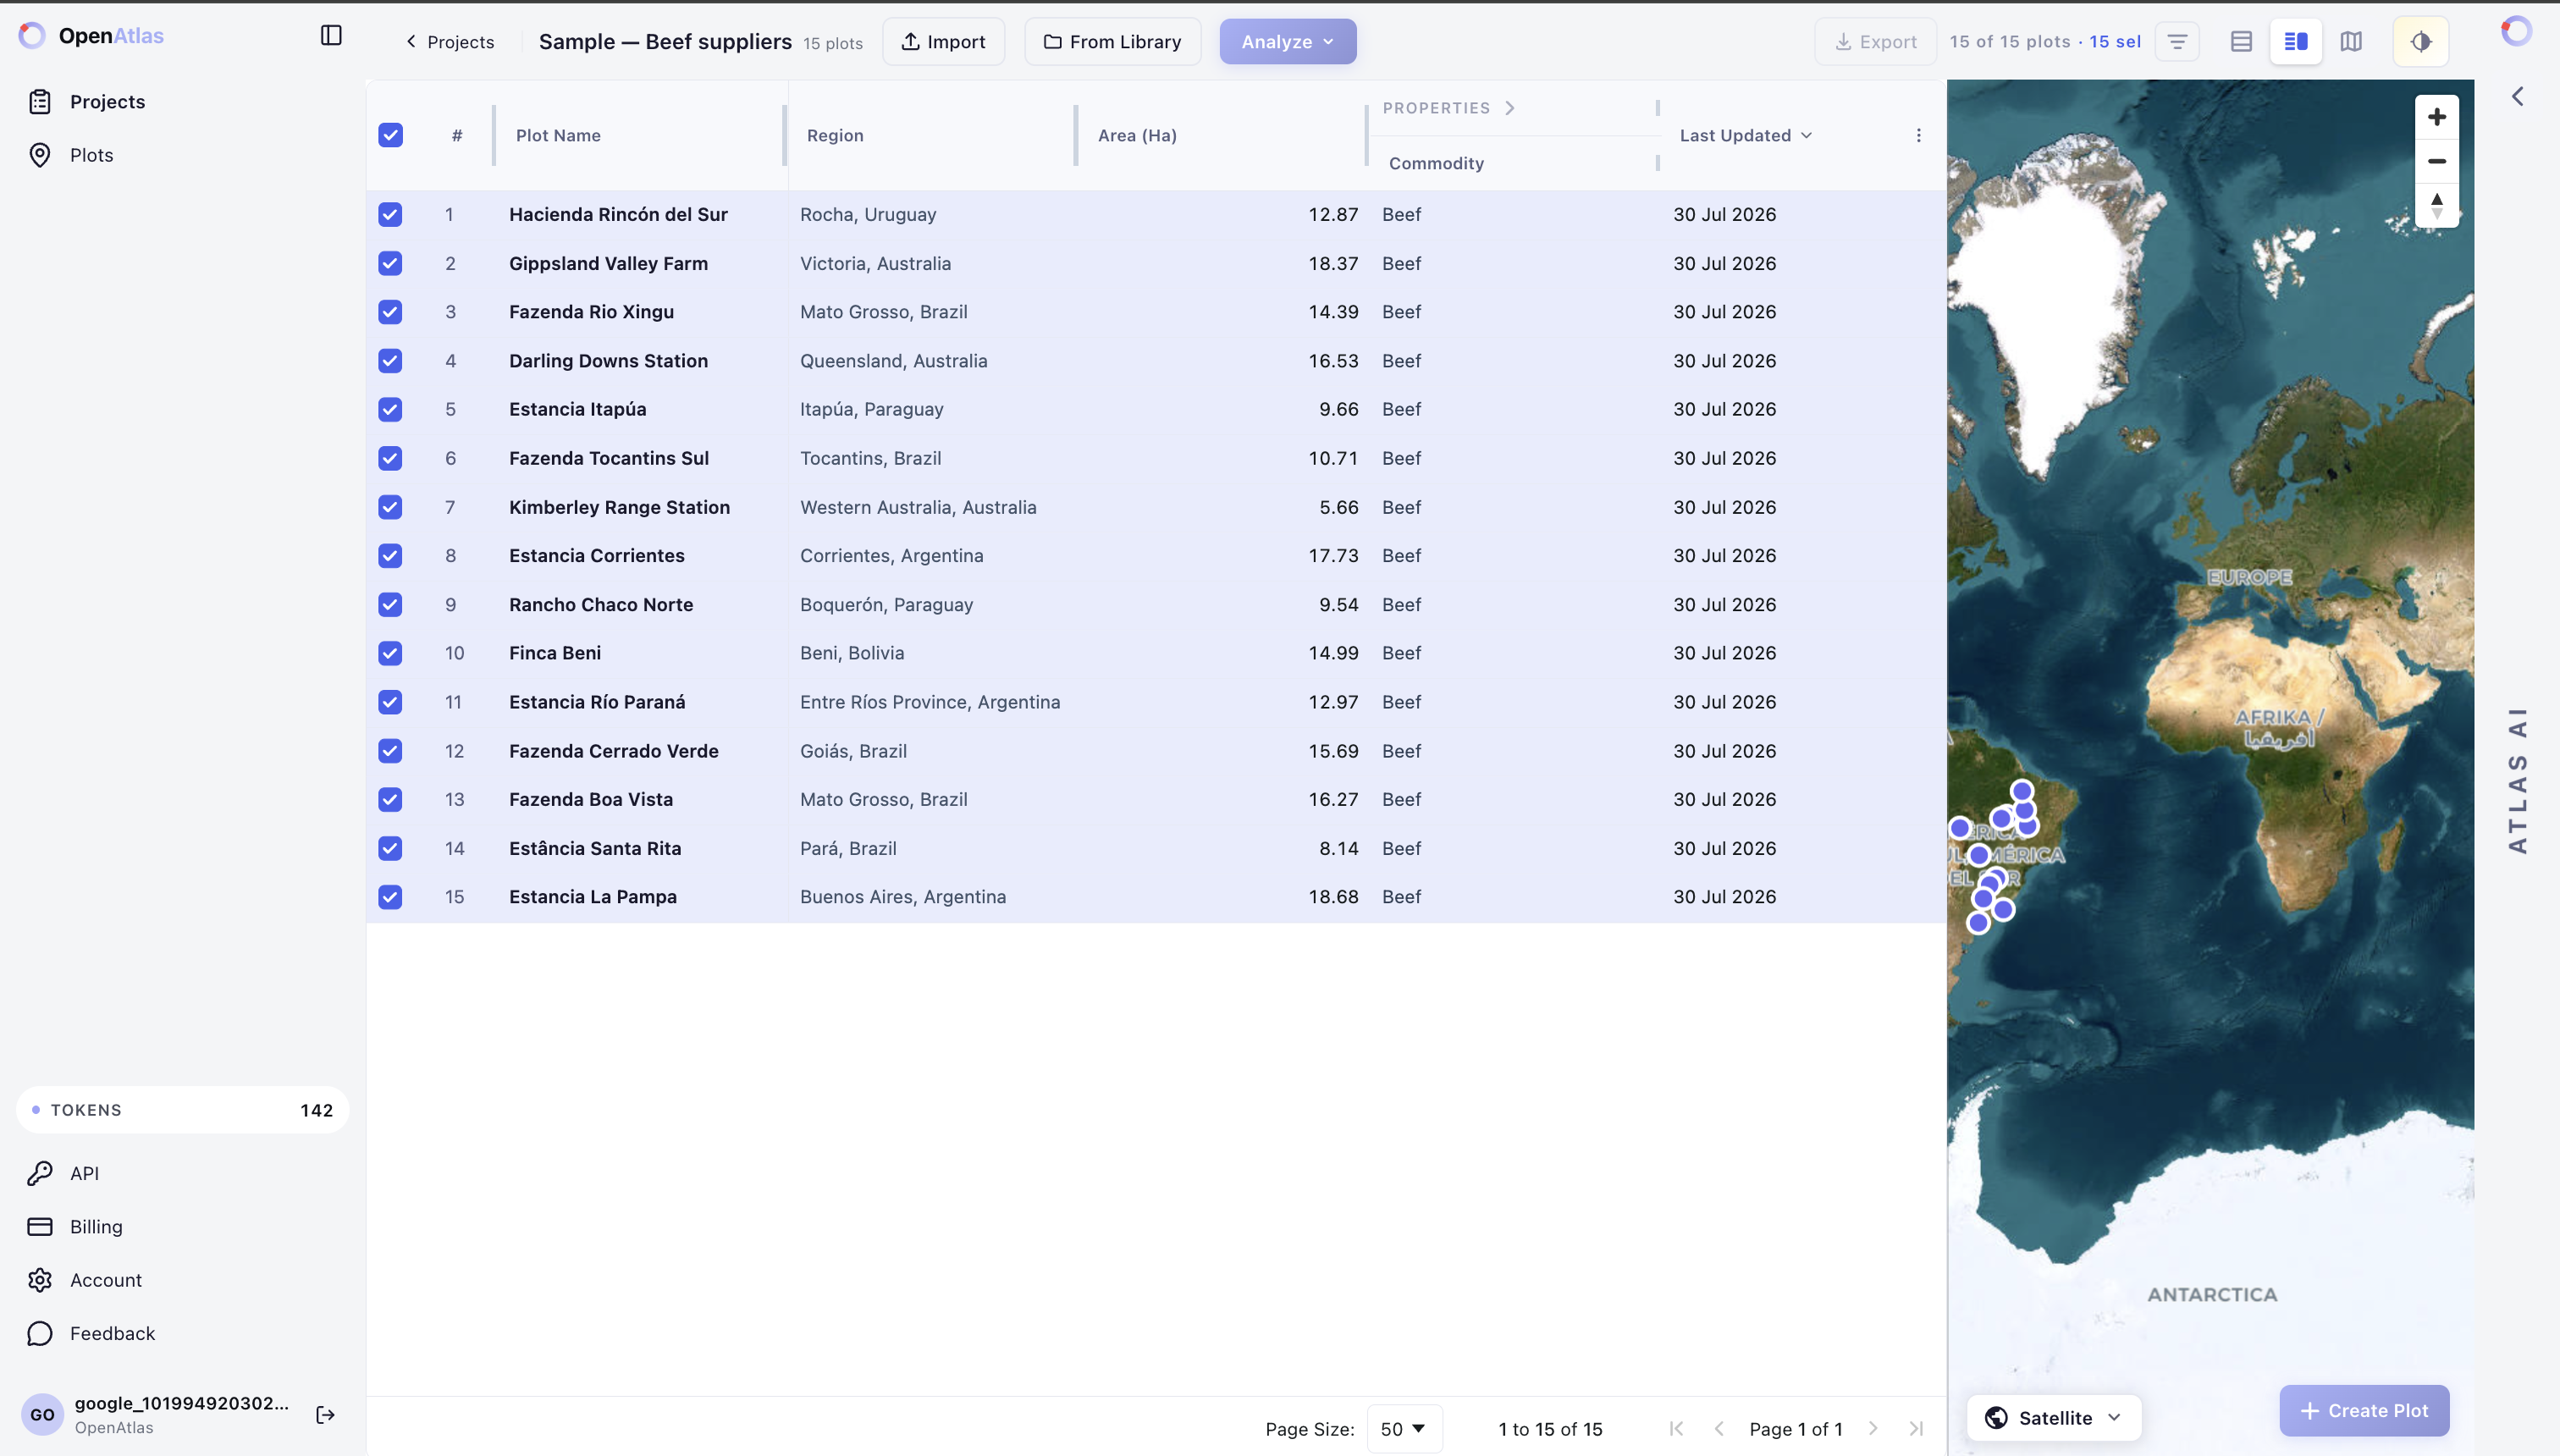
From a project, the main workspace combines:
- A plots table.
- A map.
- Analysis controls.
- Import and export actions.
- Token, API, billing, and account navigation.
Add plots
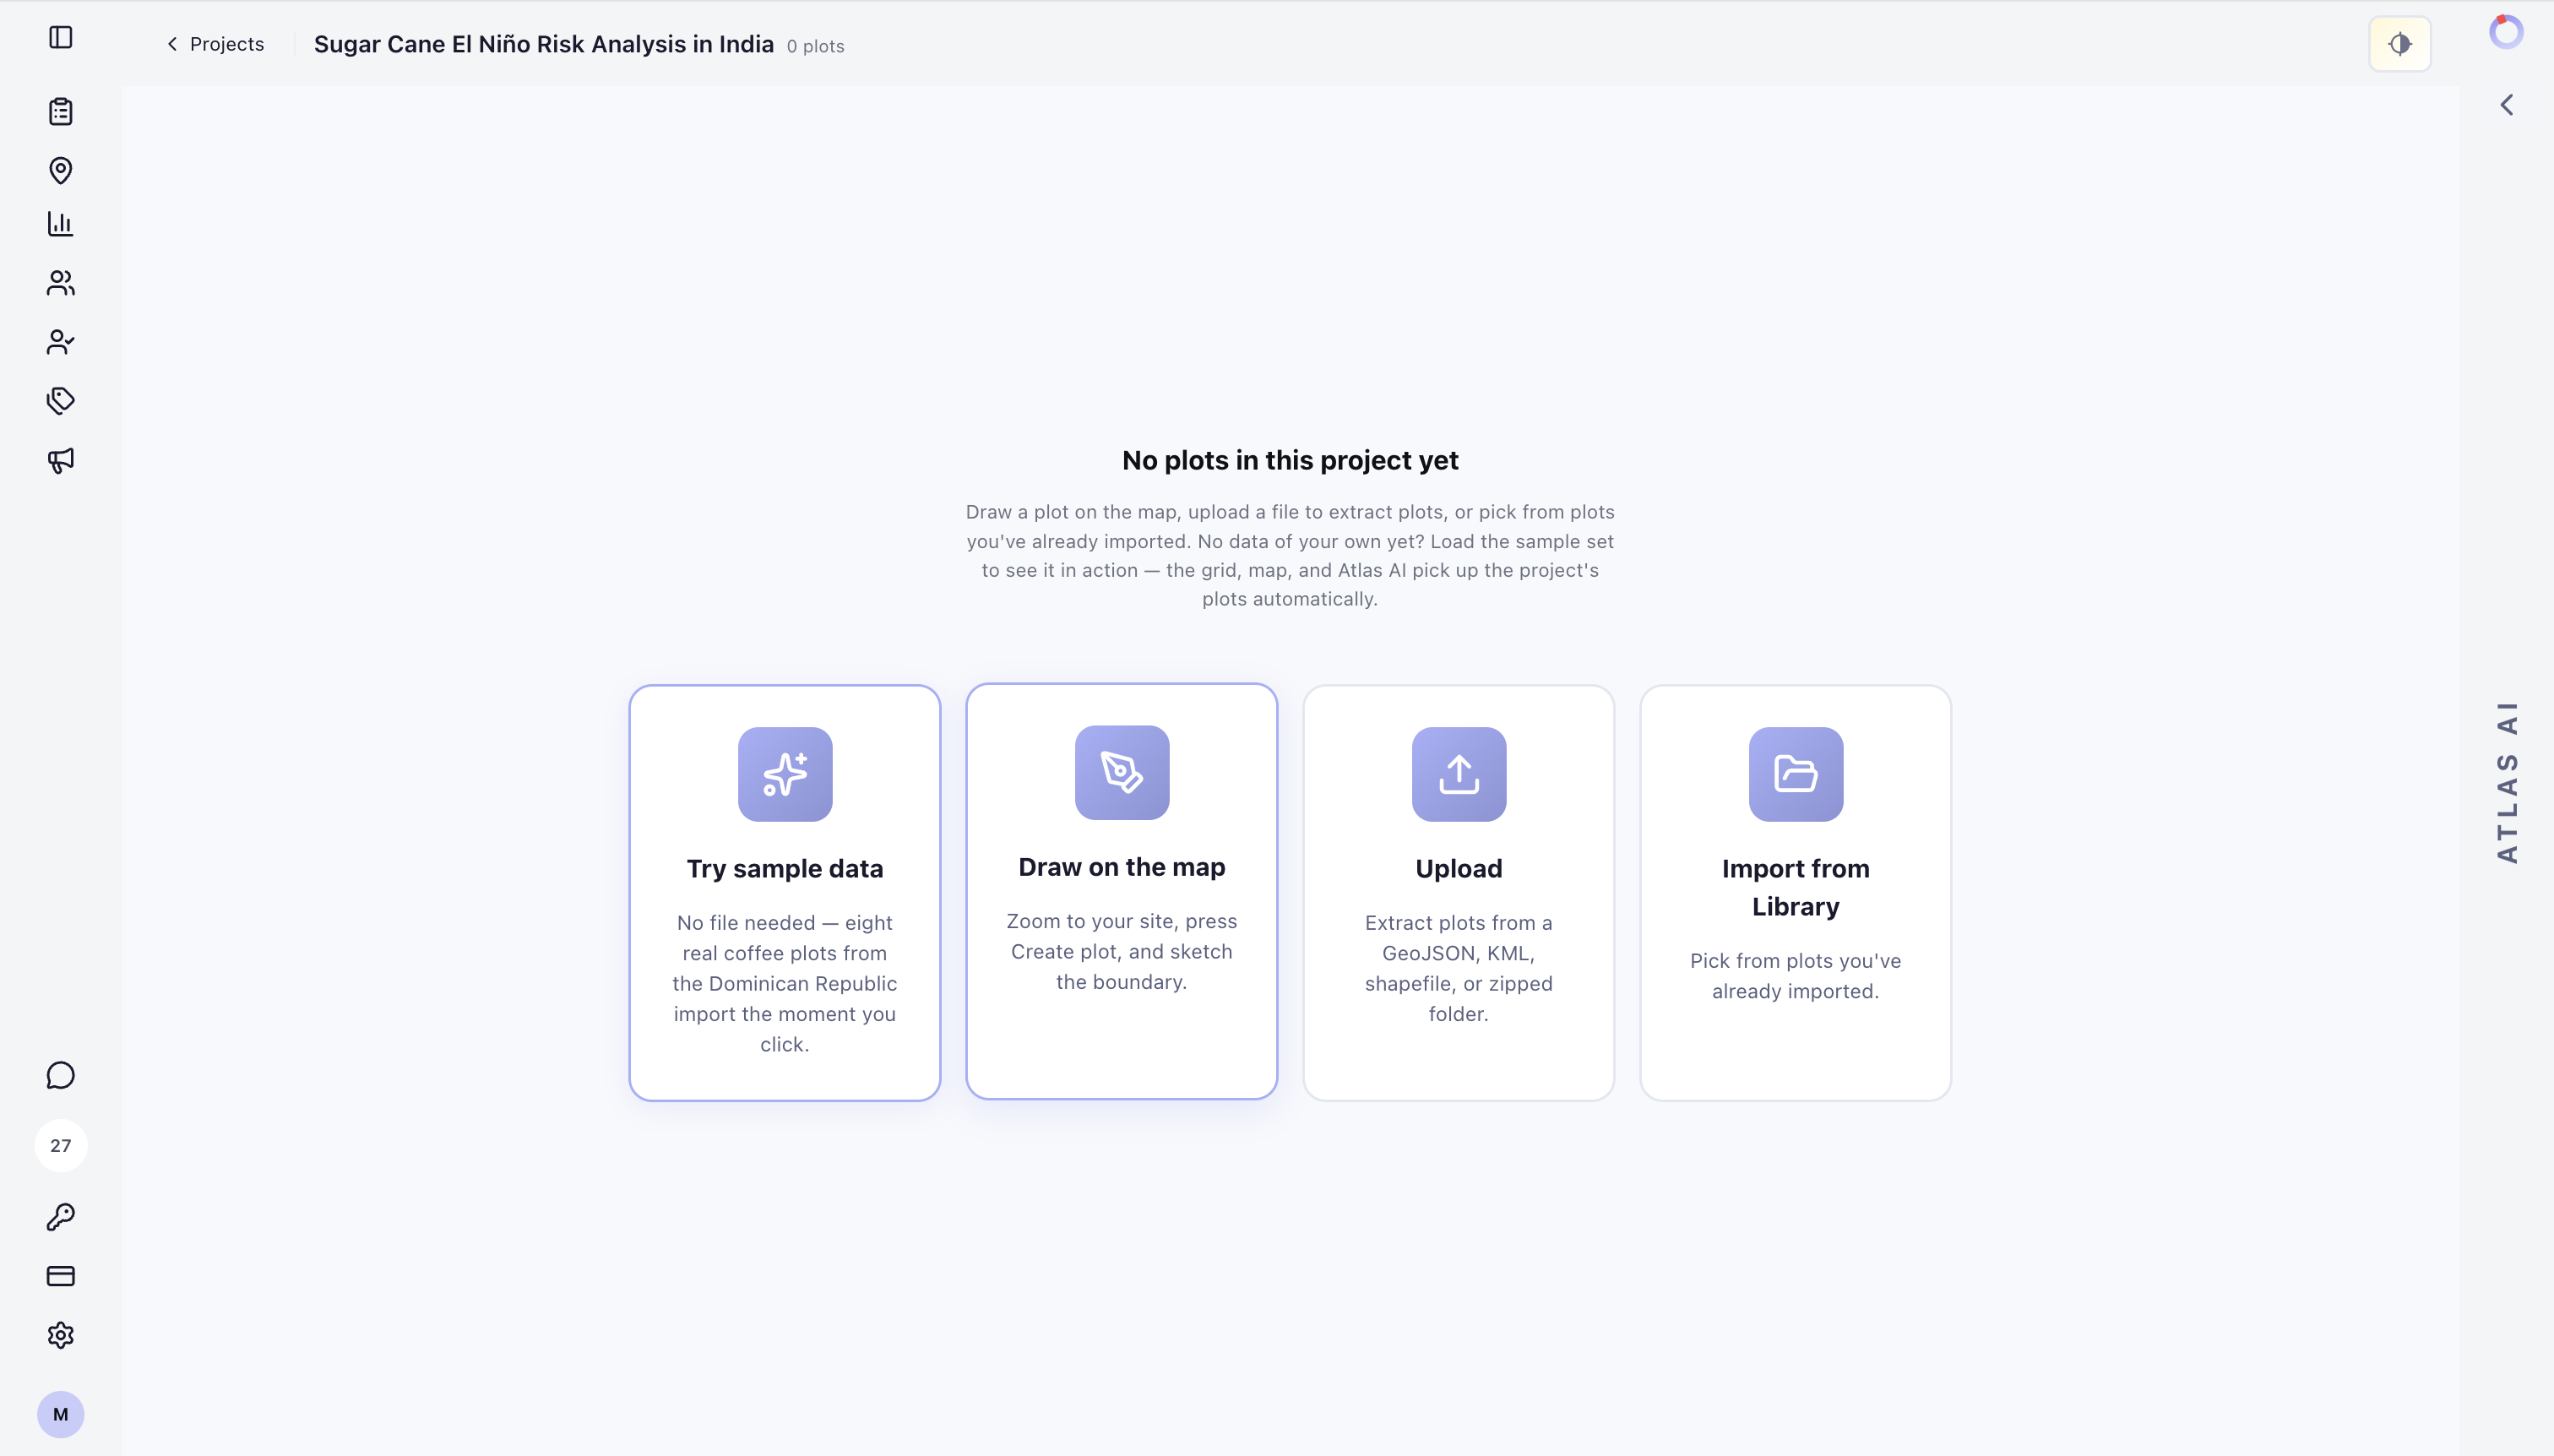
You can add plots by importing a dataset, selecting from a library, or creating a plot manually on the map. You can draw a plot directly from a project's map, including when the project does not contain any plots yet.
The app import flow accepts common geospatial files, tabular files, archives, raw coordinates, addresses, place names, and map URLs. It can help detect geometry, address, and metadata columns, including in Excel workbooks with multiple sheets or non-standard headers.
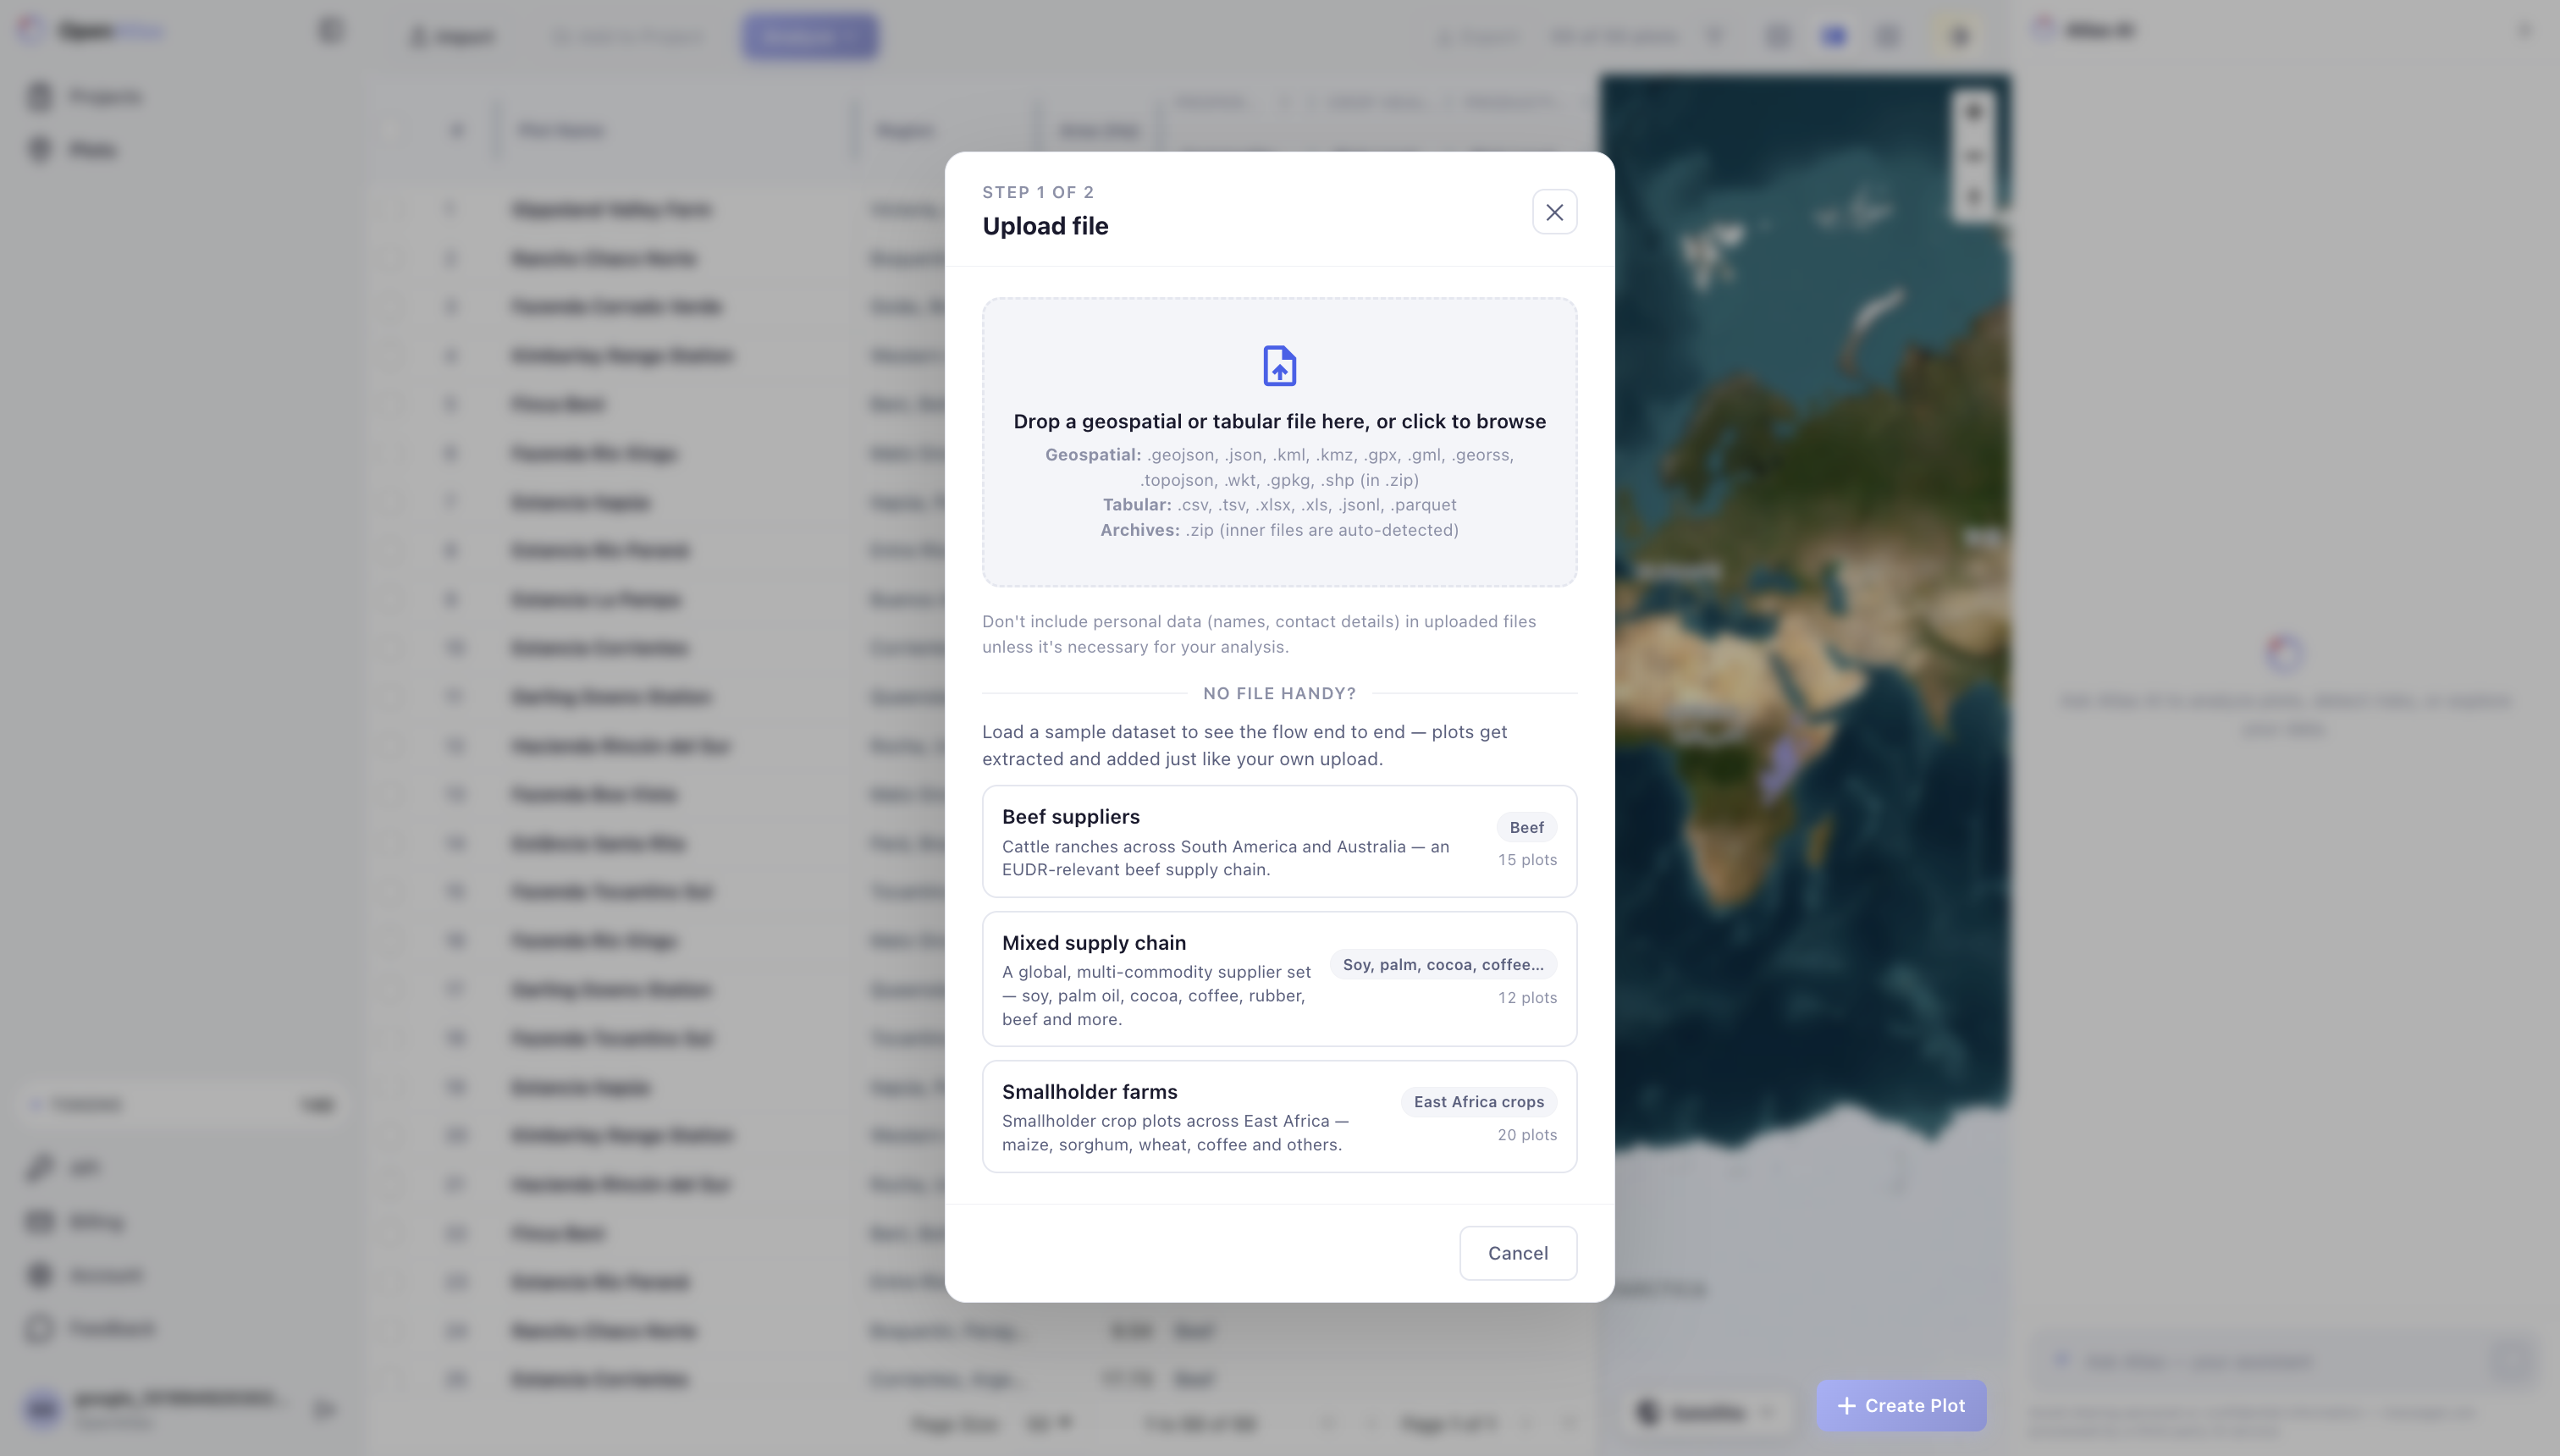
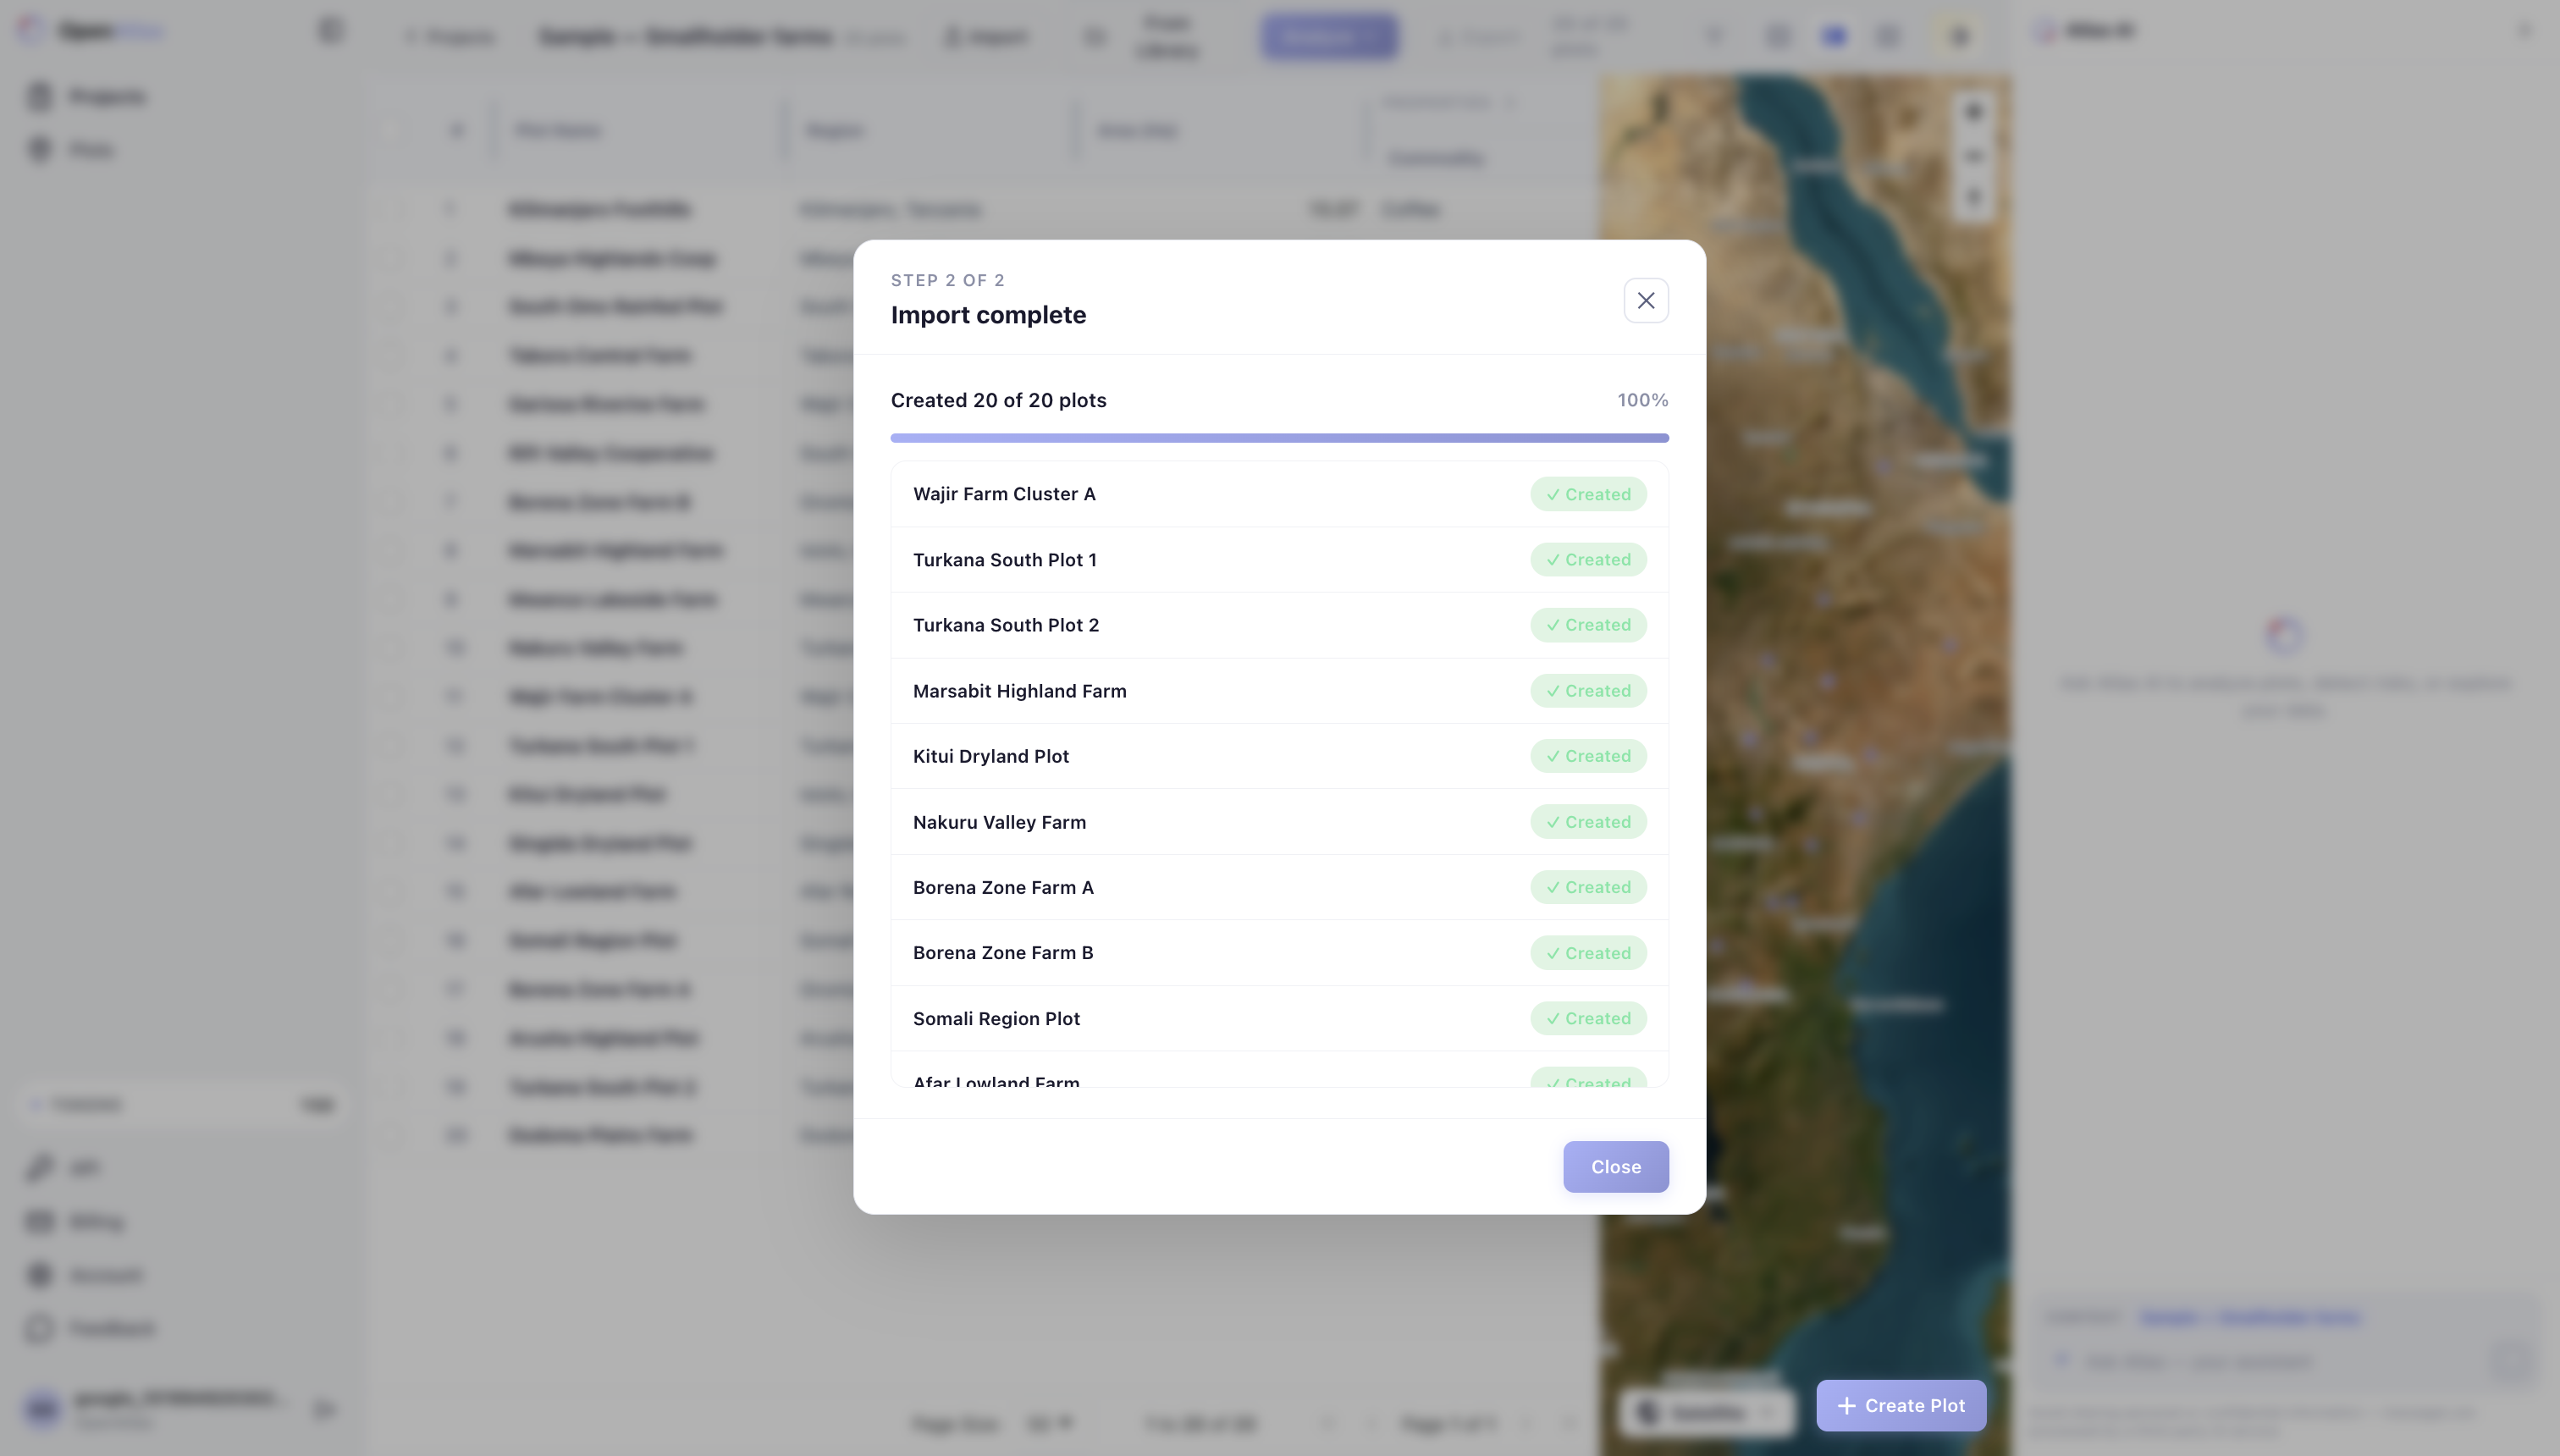
Imported plots should include valid geometry or resolvable location information, plus useful metadata such as plot name, region, commodity, and any internal supplier or owner identifiers. Vantage validates and normalizes the uploaded data, creates plots, and makes them available in the project table and map.
Create a plot on the map
To create a plot without importing a file, choose Draw on the map in an empty project or select Create plot from the project map. Zoom to the site, sketch the boundary, and finish the shape to add the plot to the project.
Select plots
Select the plots you want to analyze from the table or map. Selection controls which plots are used when starting an analysis or preparing exports.
For large projects, review the selected count before running analysis so token usage is intentional.
Run an analysis
Use Analyze to choose an analysis template or configure checks manually. For EUDR workflows, make sure each selected plot has the required commodity and harvest date available either on the plot or in the analysis configuration.
The analysis modal supports quick templates and manual check selection. Quick templates cover EUDR compliance, supplier-site risk, farm health, physical risk, operating-asset workflows, site suitability, and visual verification. Manual checks are grouped by horizon, including Active, Track Record, Outlook, and Structural Exposure signals.
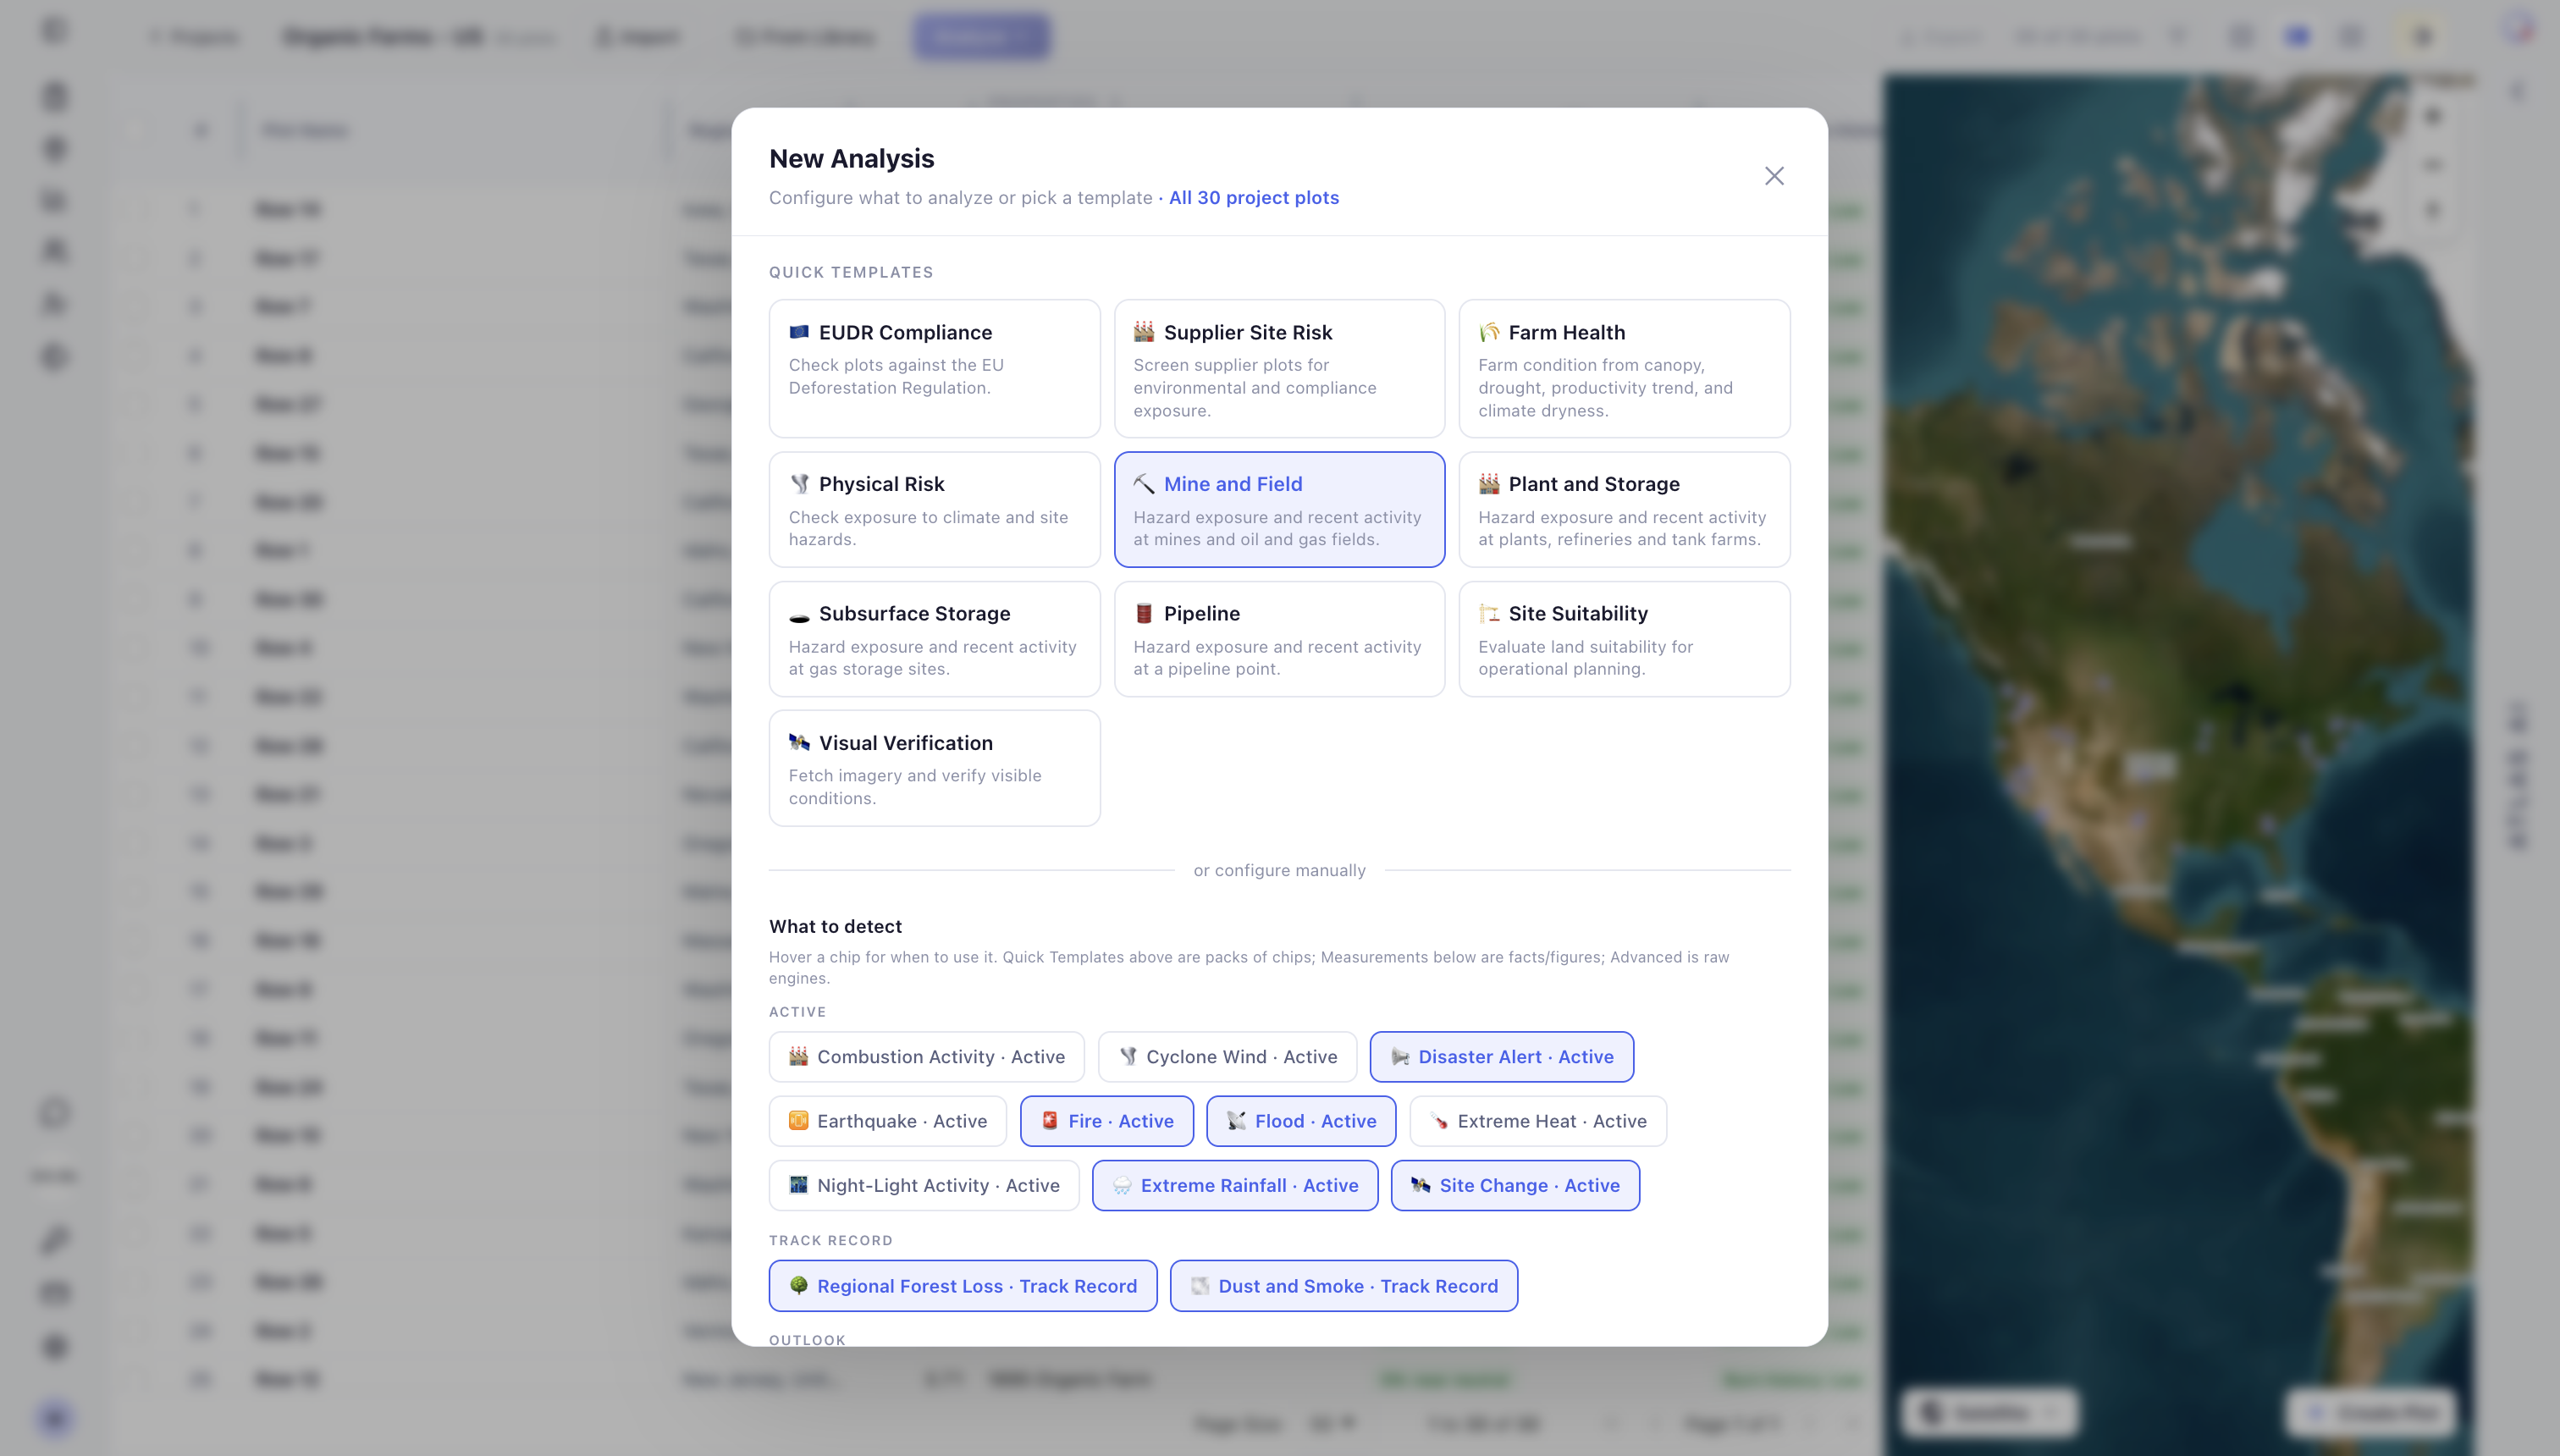
For EUDR workflows, select EUDR Compliance. This template groups the checks needed for the EU Deforestation Regulation so compliance review can be configured quickly.
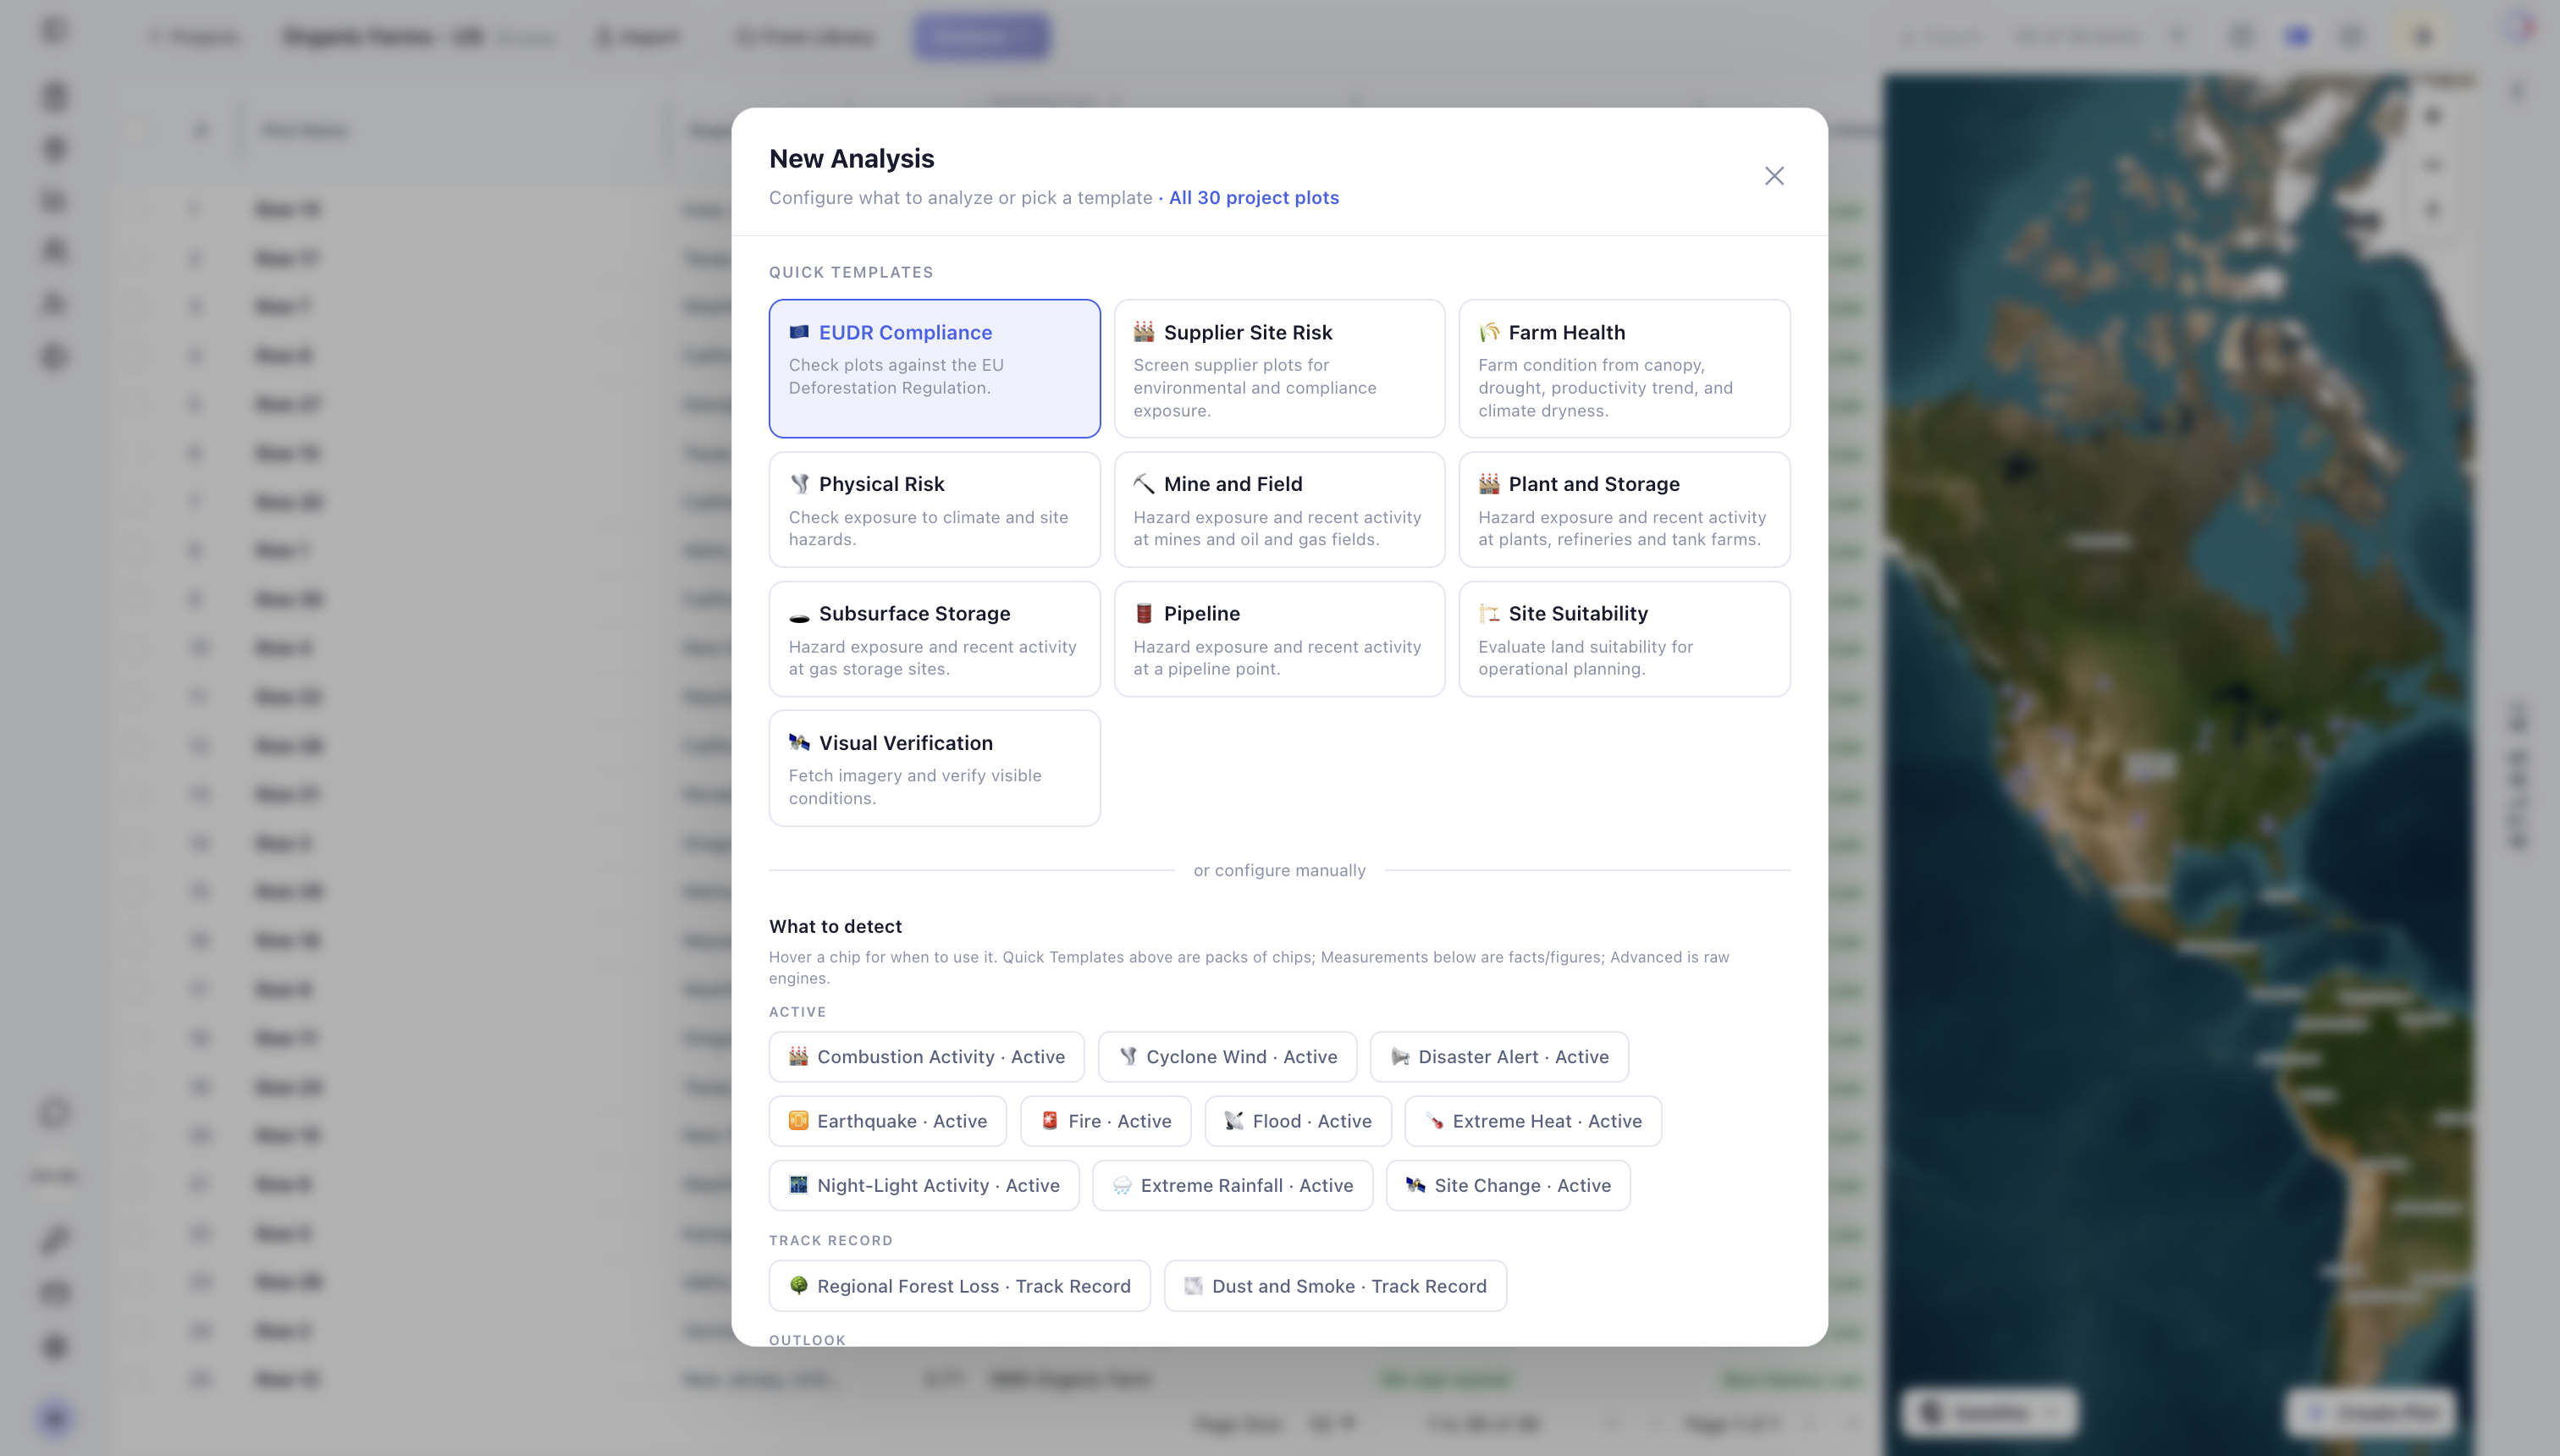
For agricultural monitoring, portfolio screening, or operating-asset review, choose the relevant template or select the checks you need manually. See Geospatial Analysis for descriptions of the available signals and how to interpret their results.
Some checks use measurements or time windows. Confirm the requested measurements and dates before running the analysis.
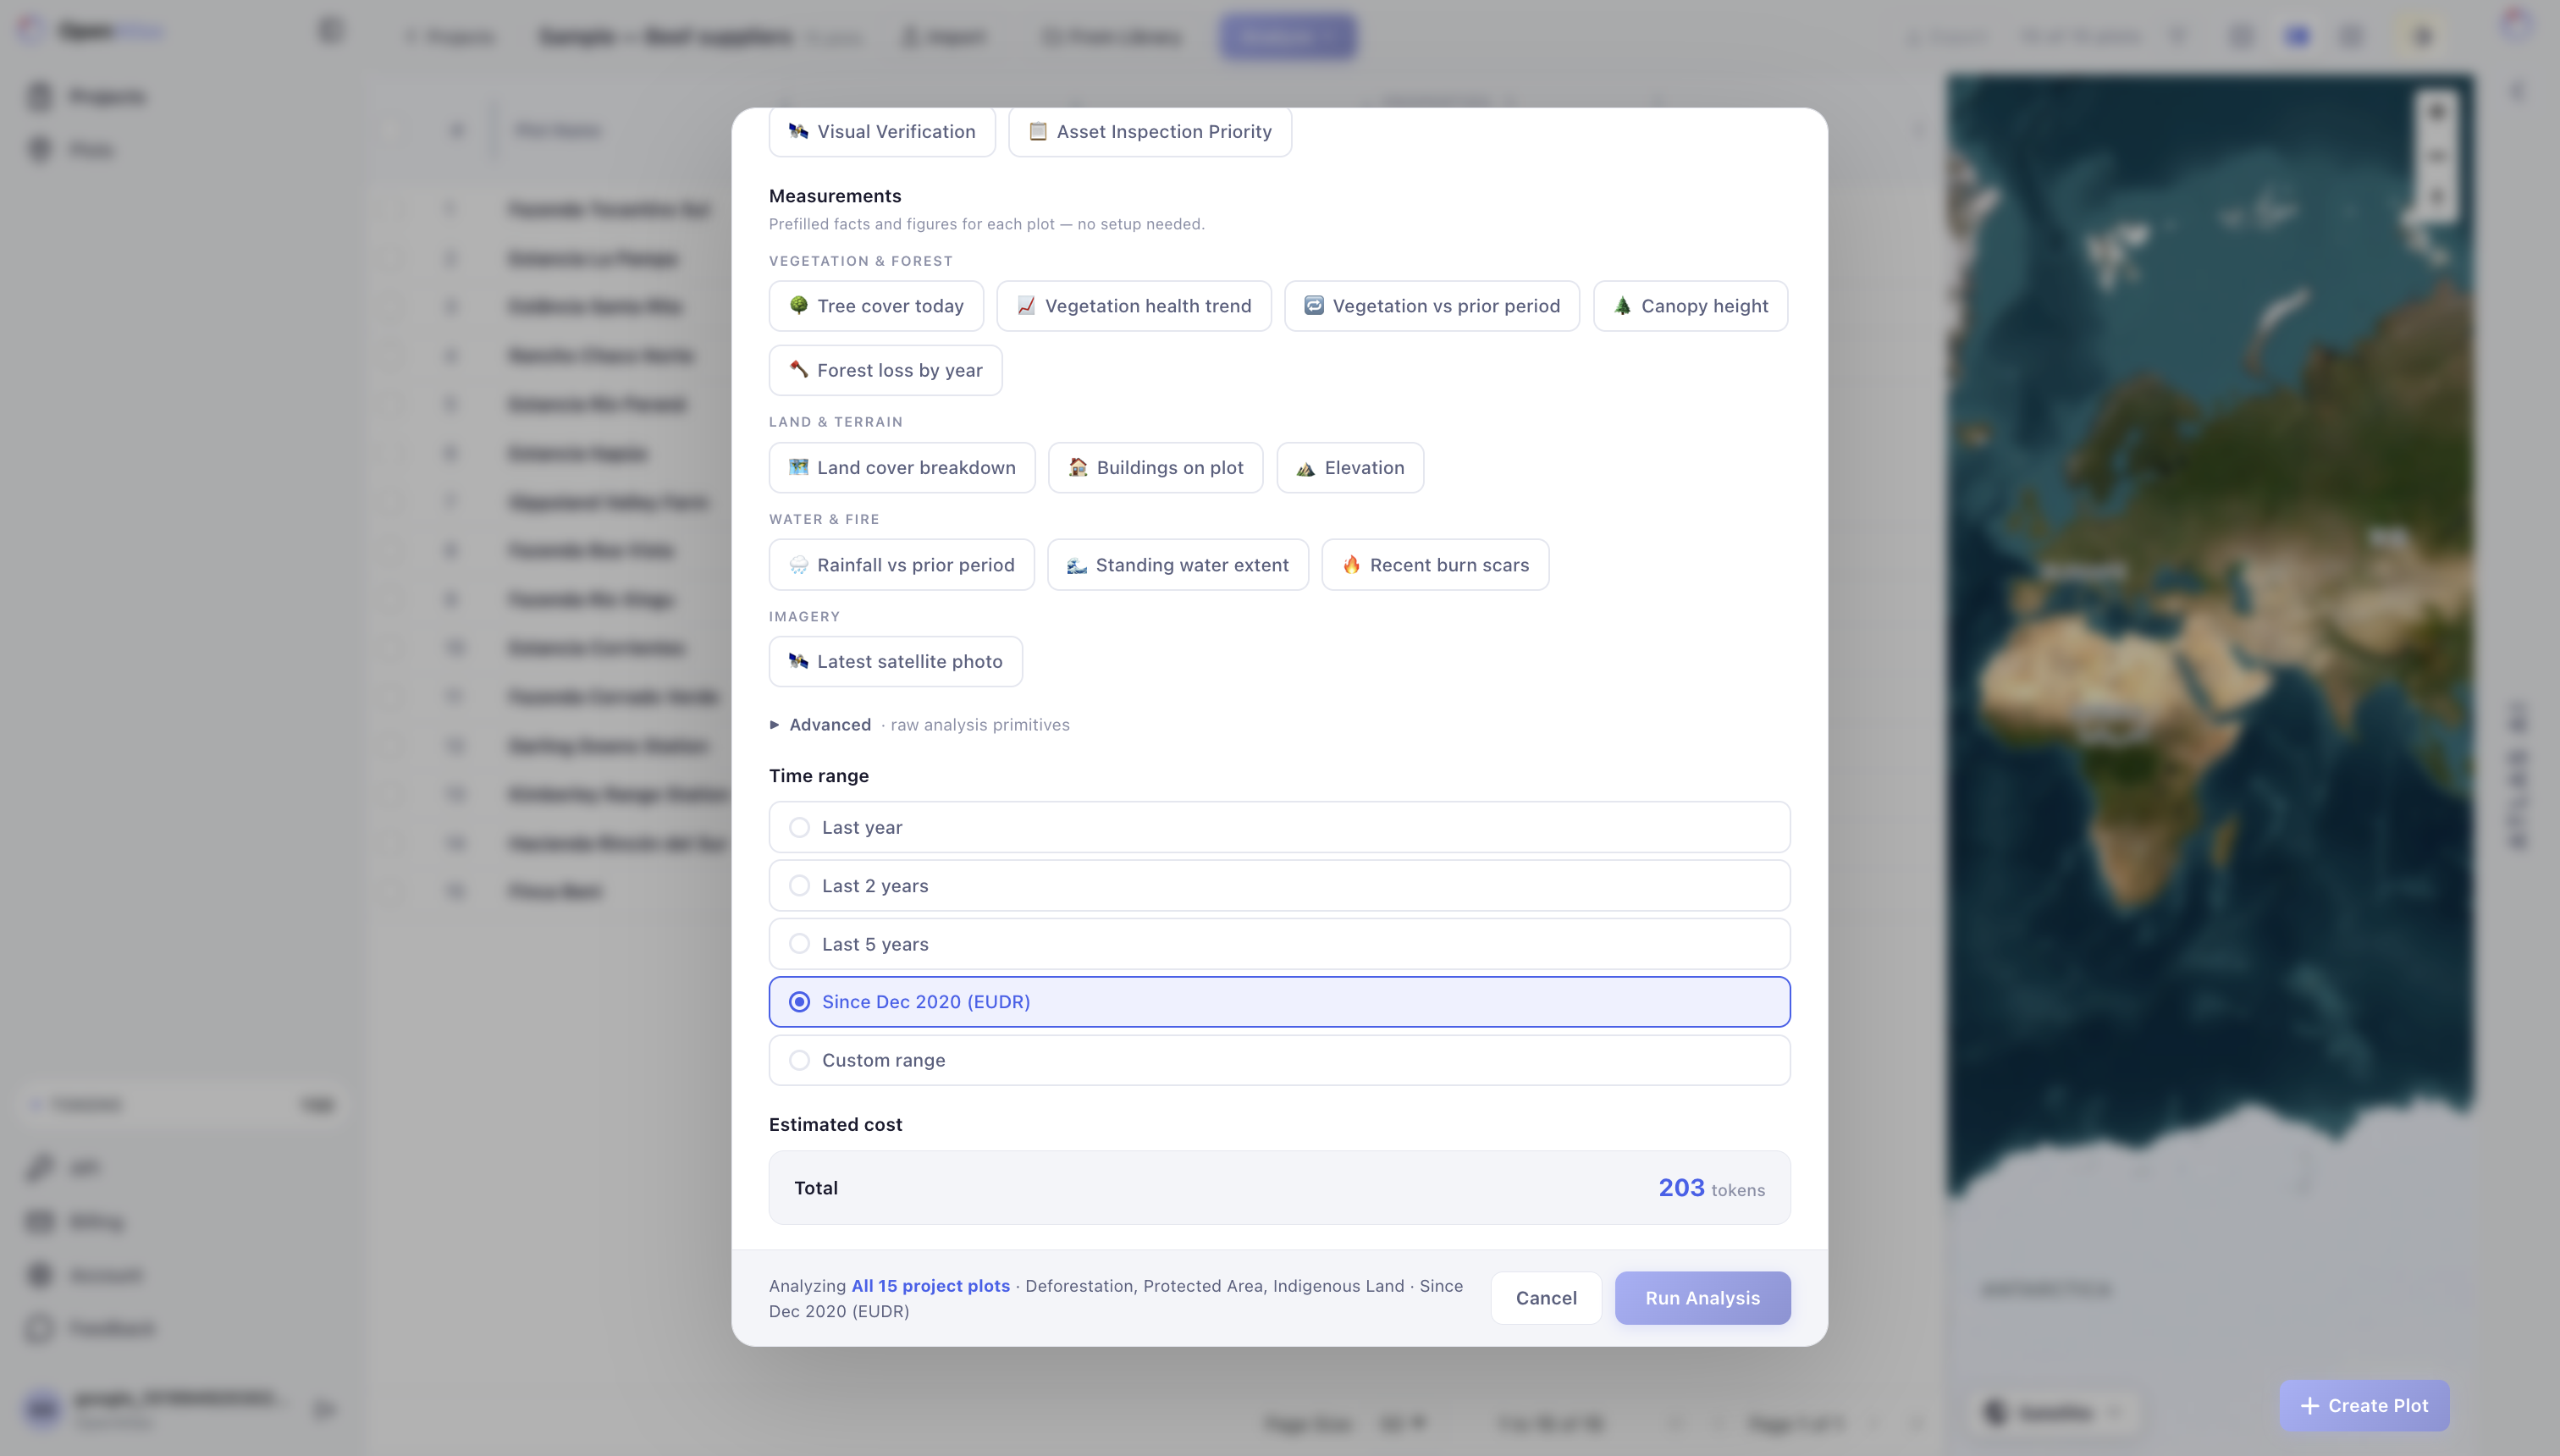
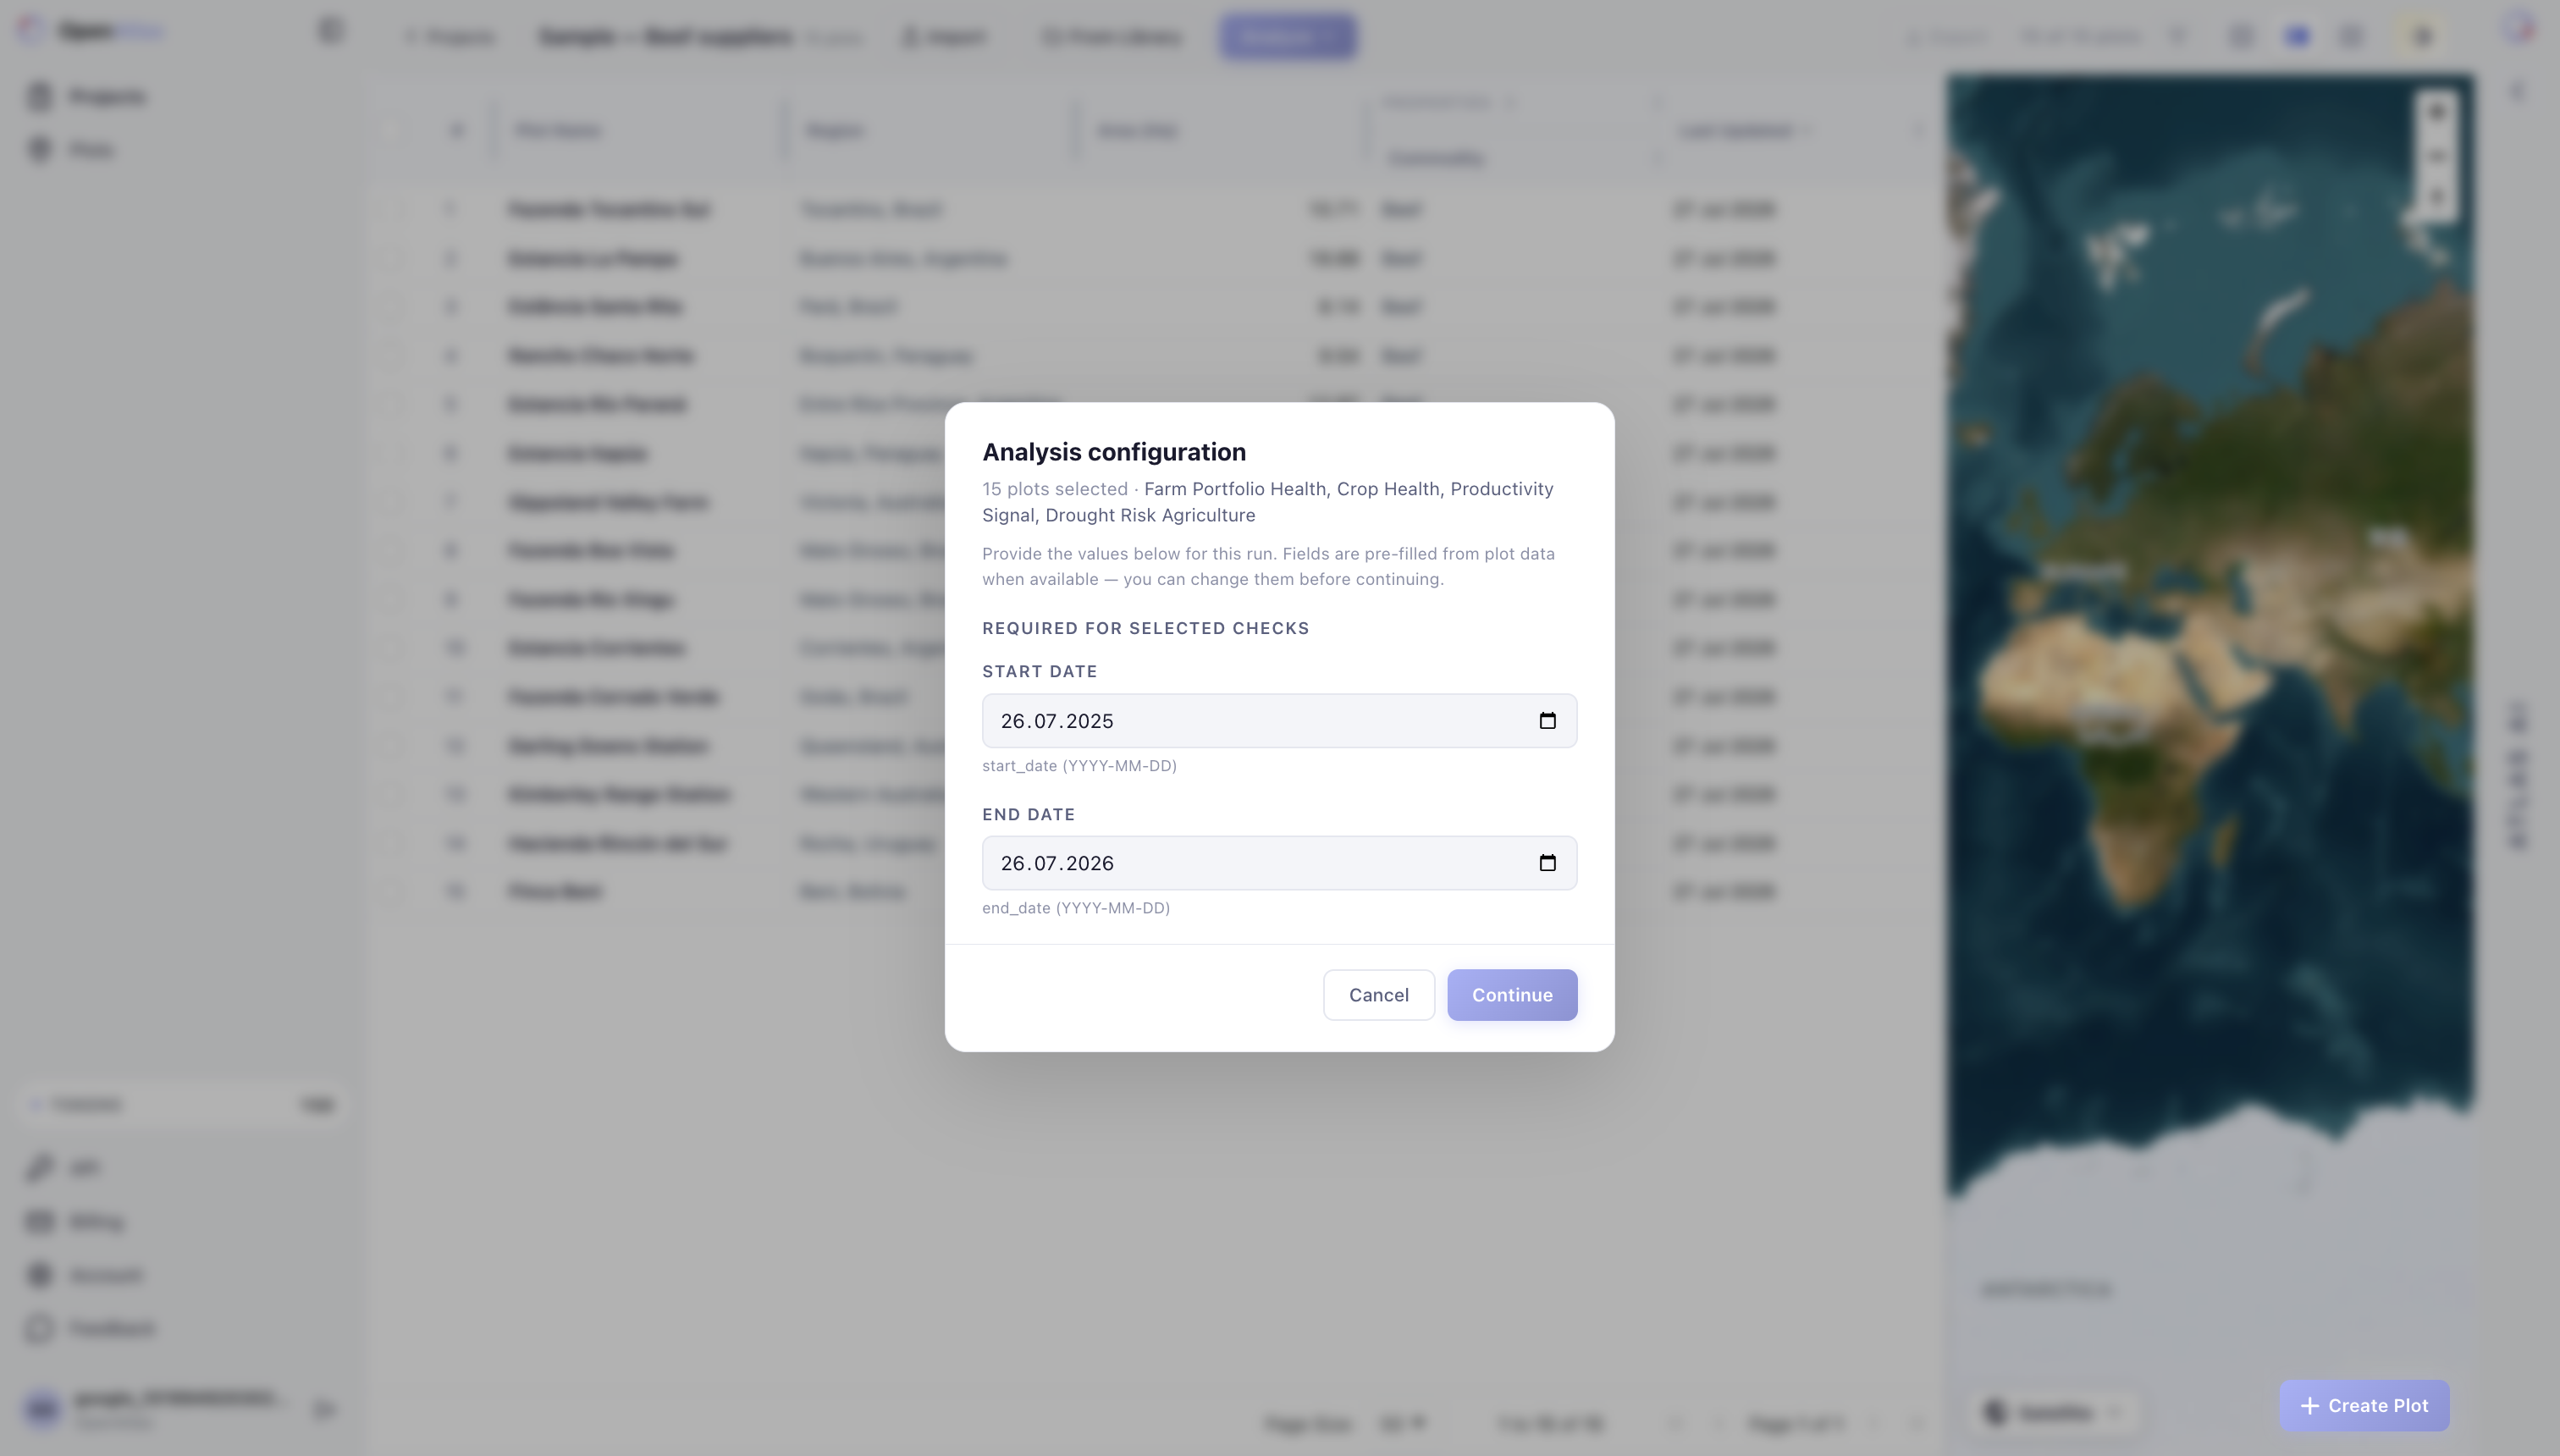
When a selected analysis needs a date range, Vantage asks for the missing configuration before the job is created.
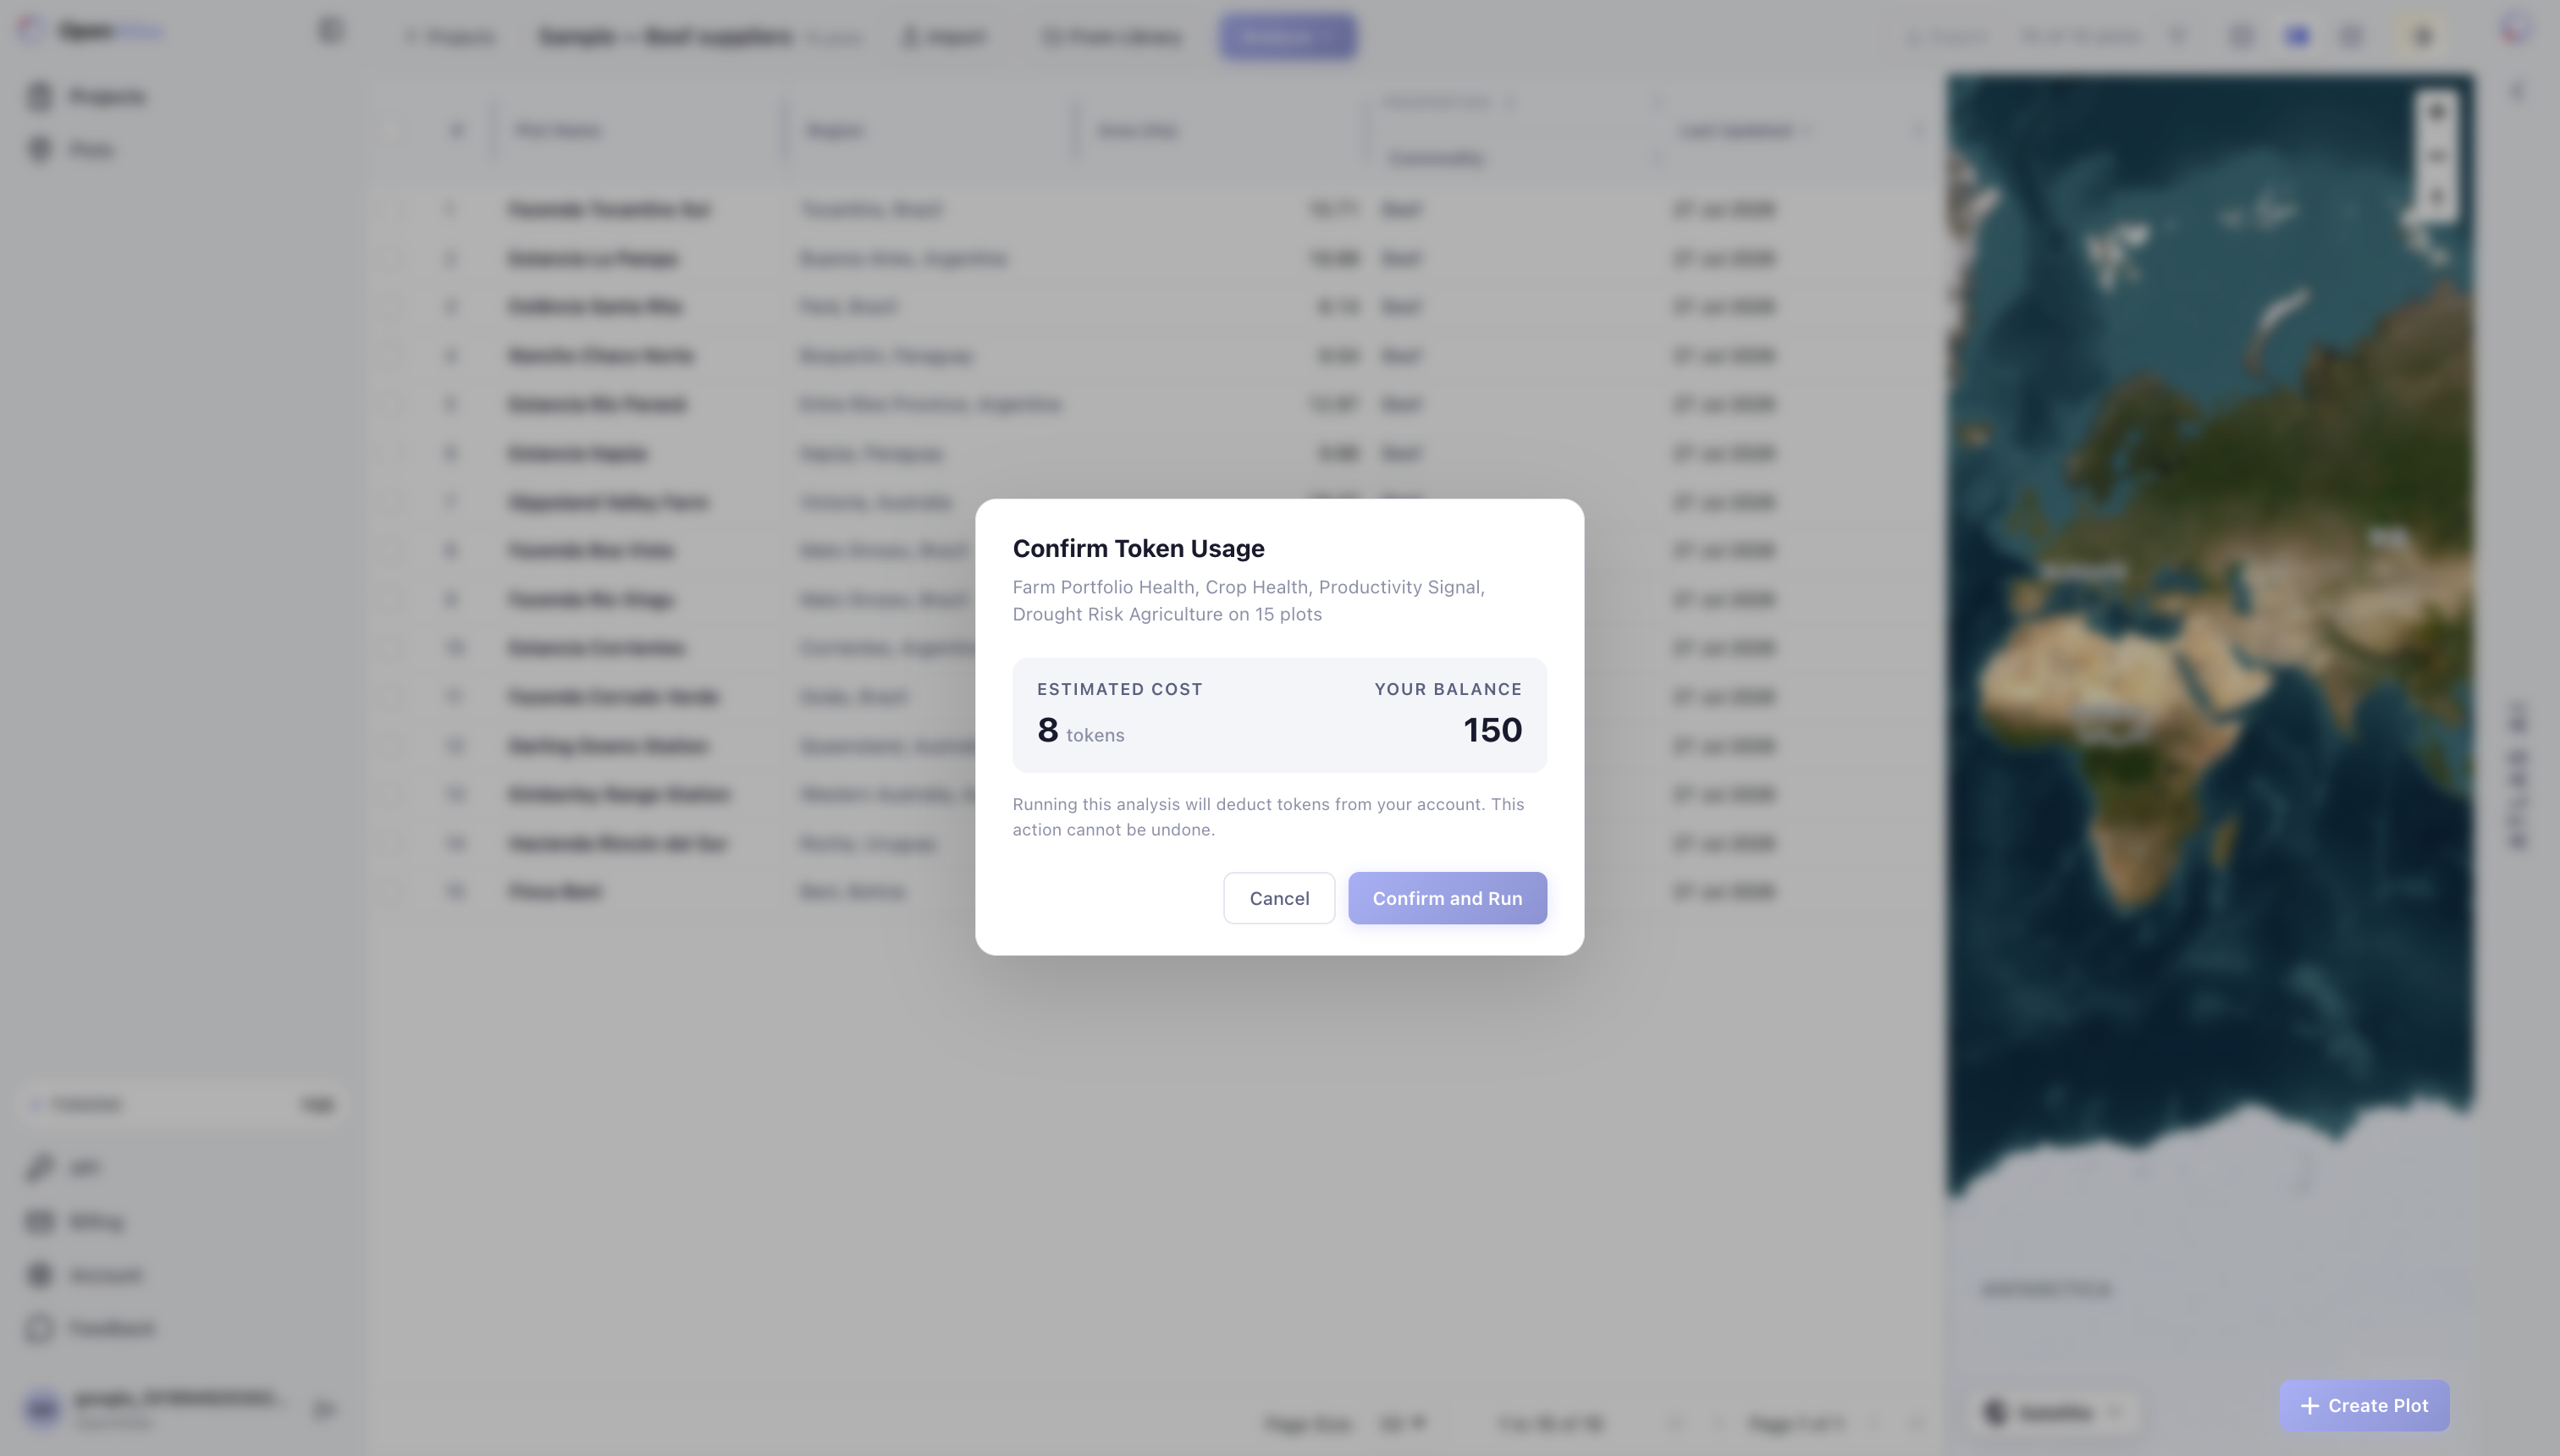
Before submitting the job, Vantage shows the estimated token cost and current token balance. Confirm the scope and cost before selecting Confirm and Run.
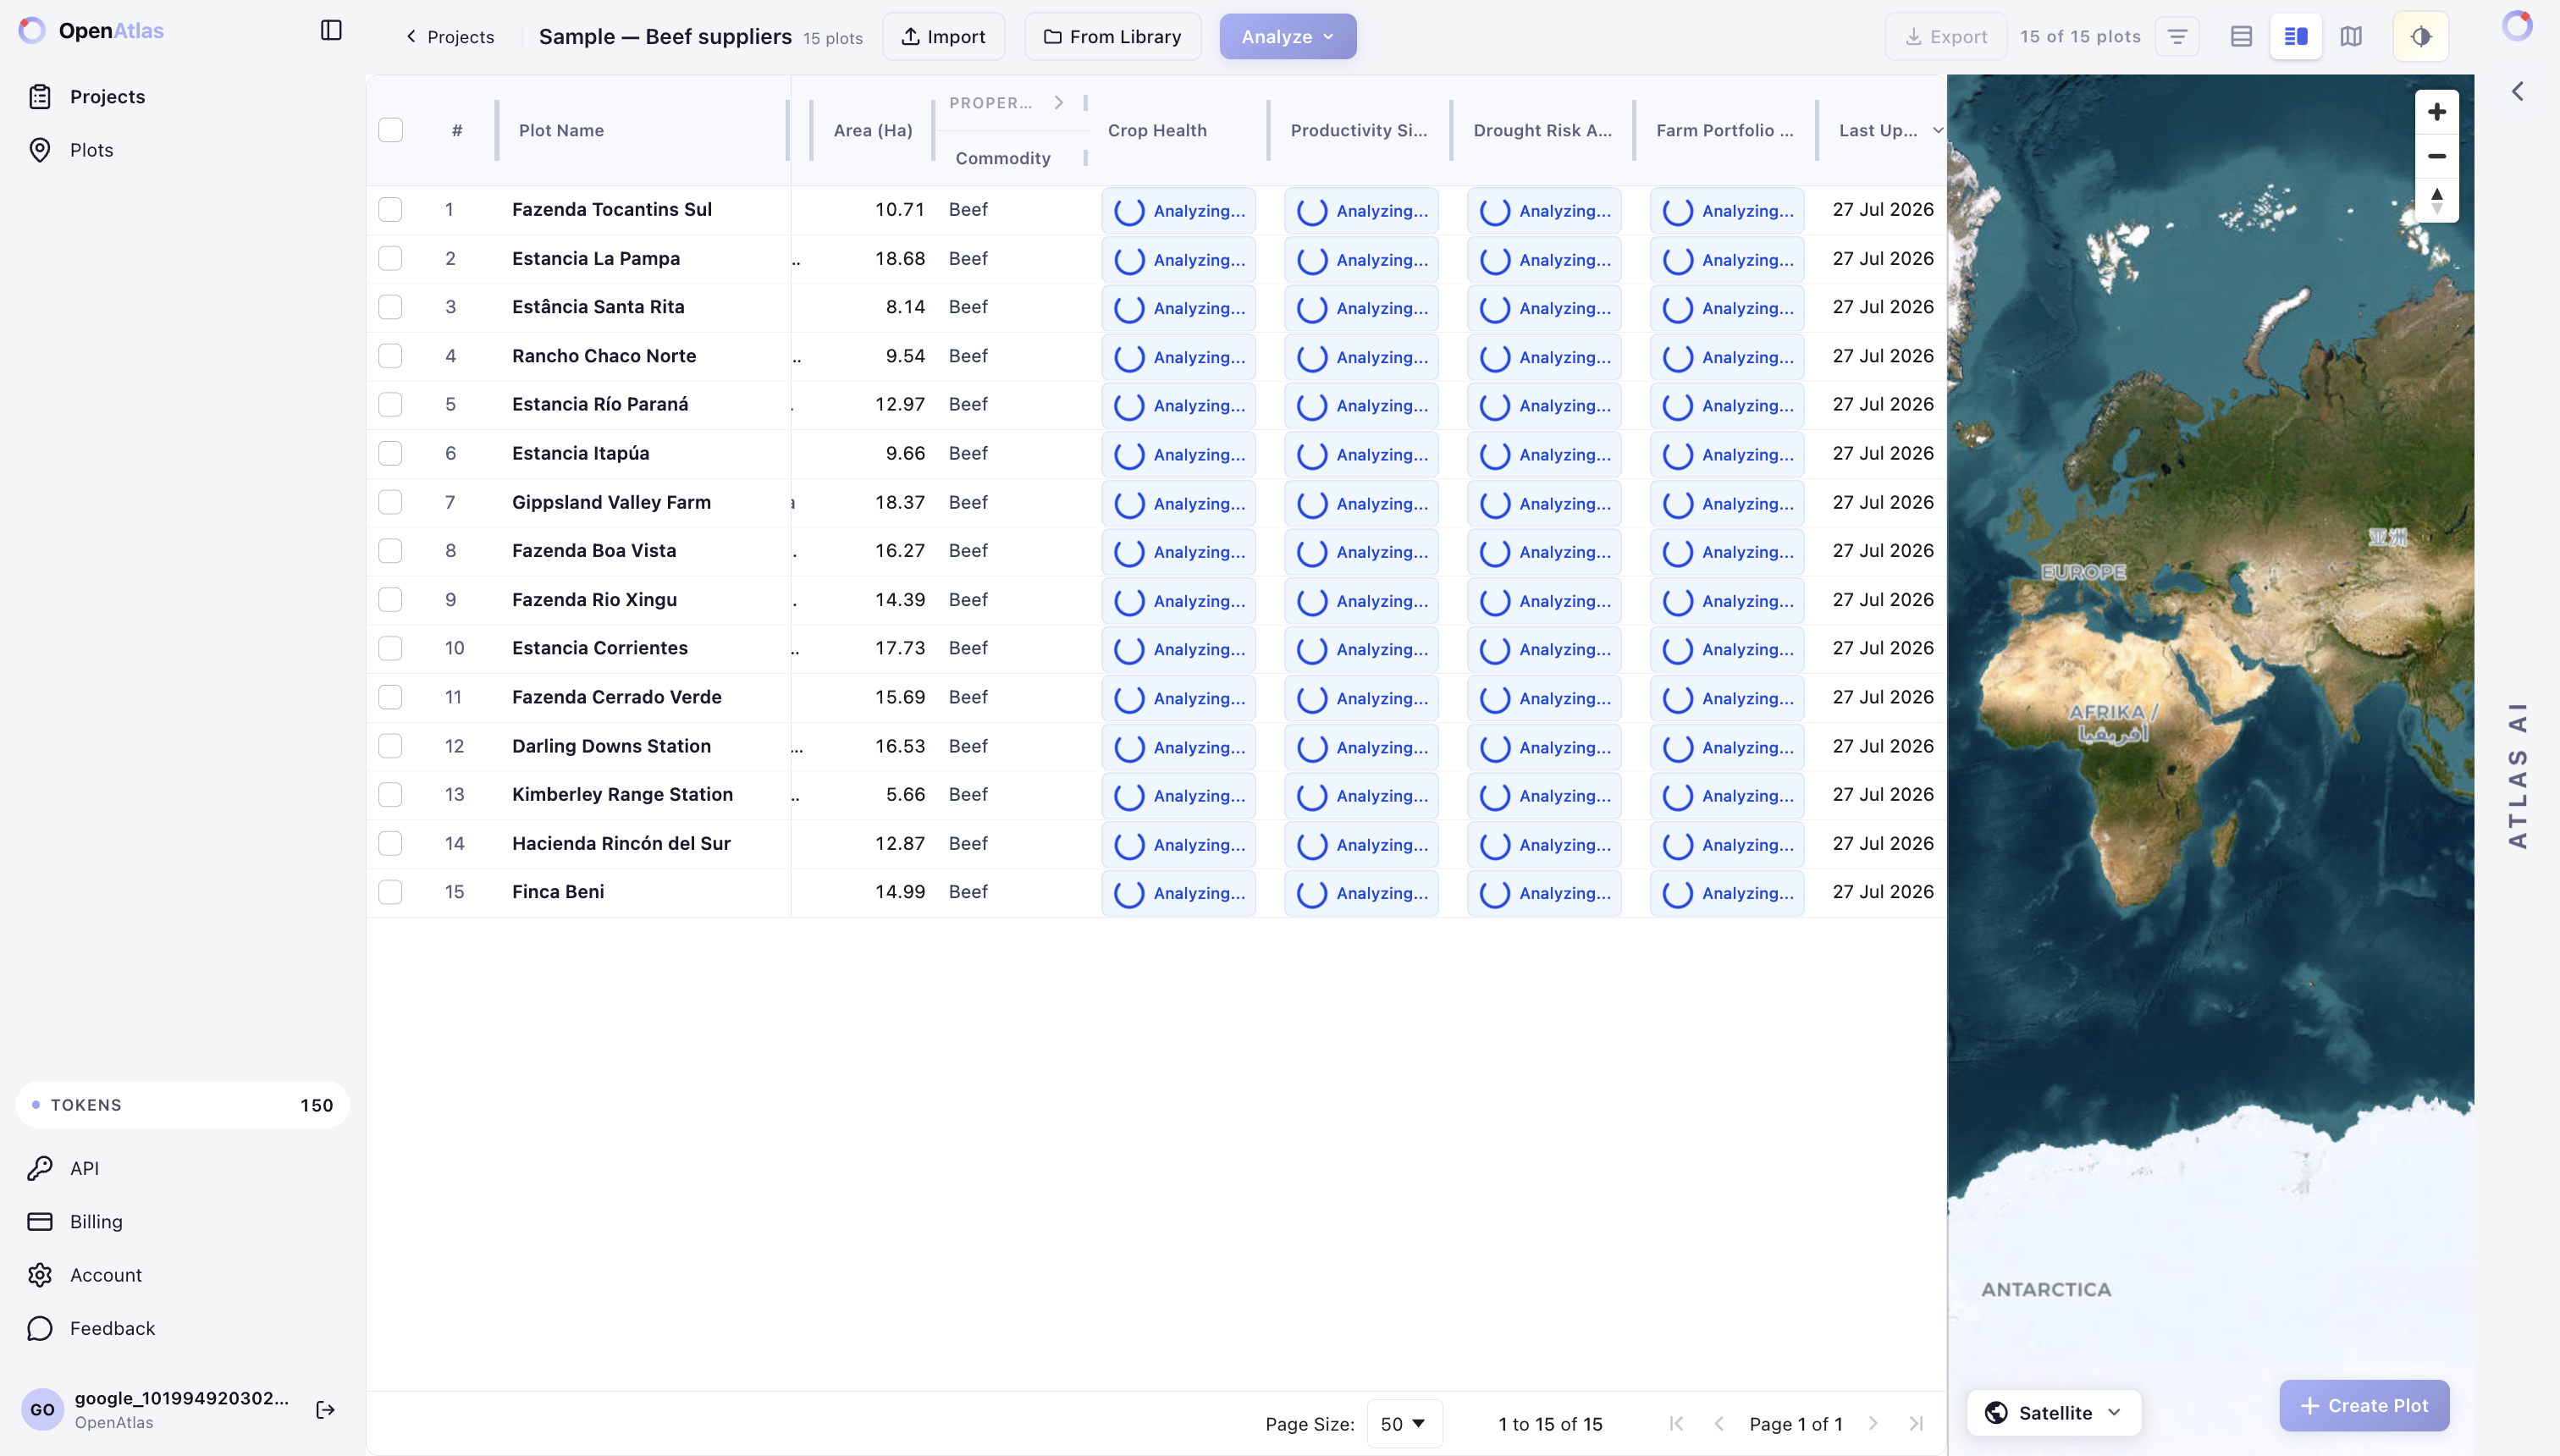
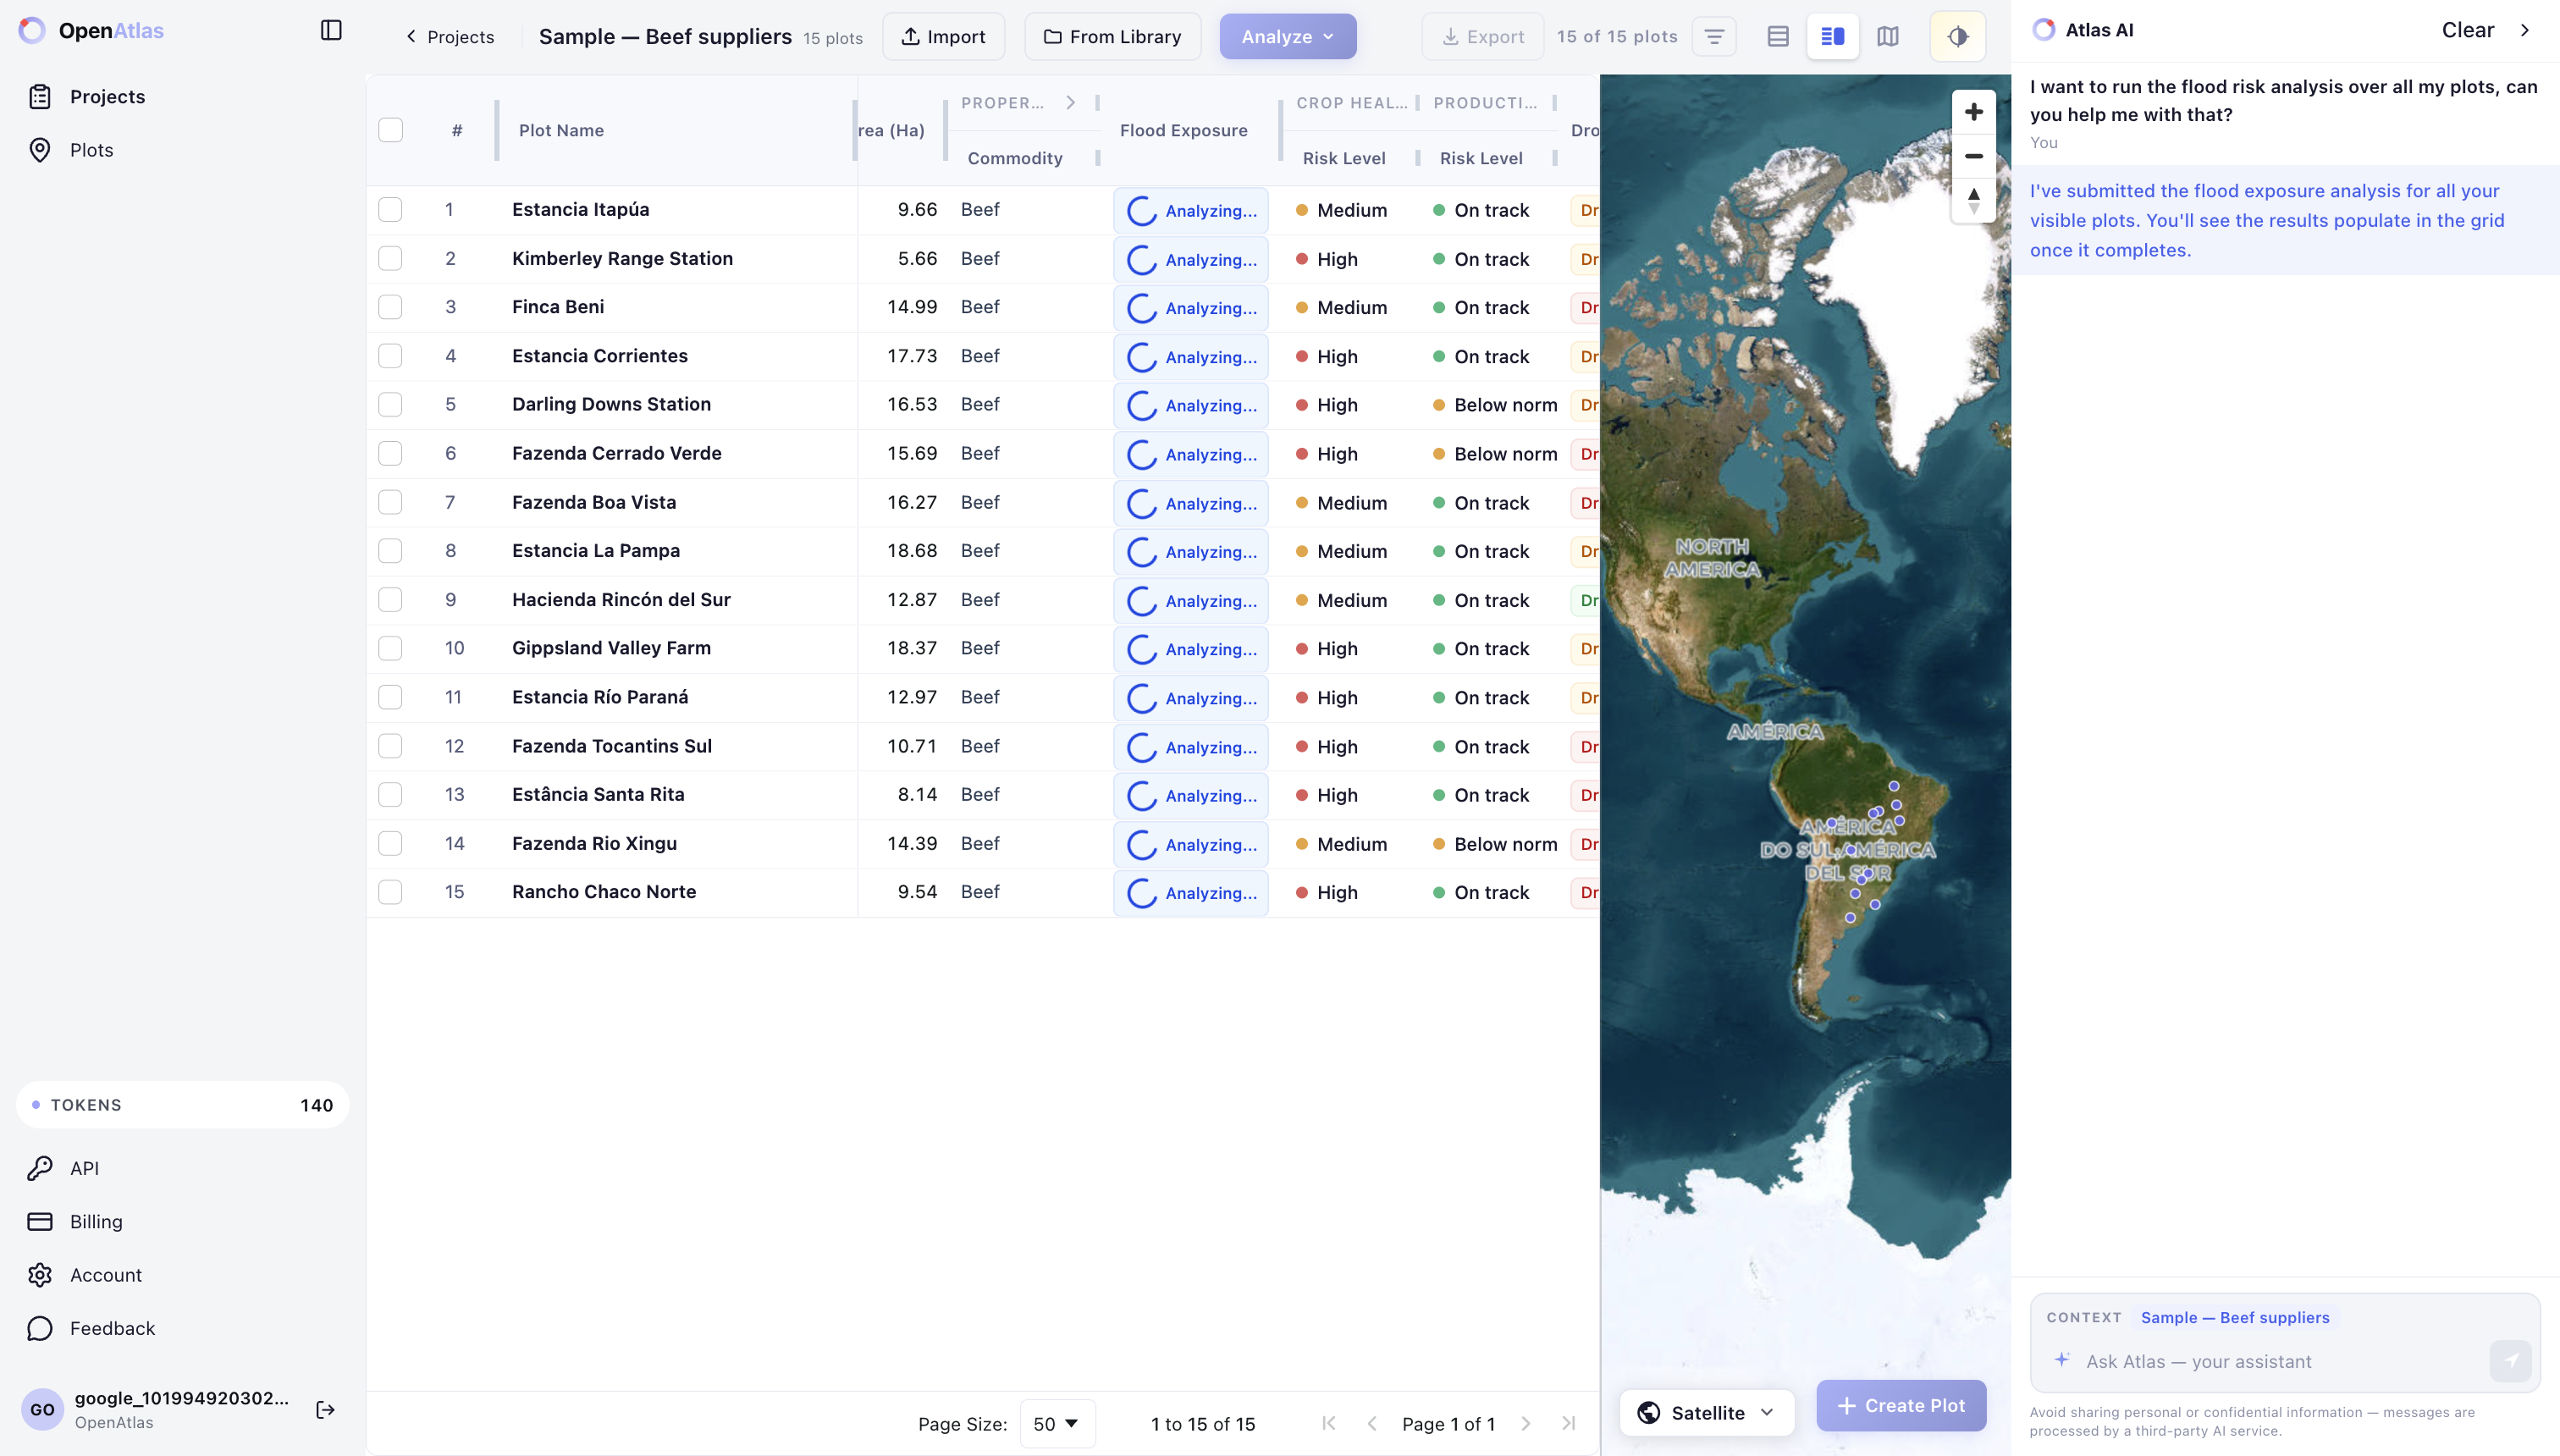
When the analysis starts, Vantage creates a job and processes each selected plot asynchronously. Running checks are shown directly in the table.
Use Atlas AI
Atlas AI helps users run the right analysis for a specific application without manually choosing every check. Ask Atlas for the outcome you need, and it can recommend or prepare the relevant analysis based on the current project and visible plots.
Before submitting, review the analysis name, selected plot count, and estimated token cost.
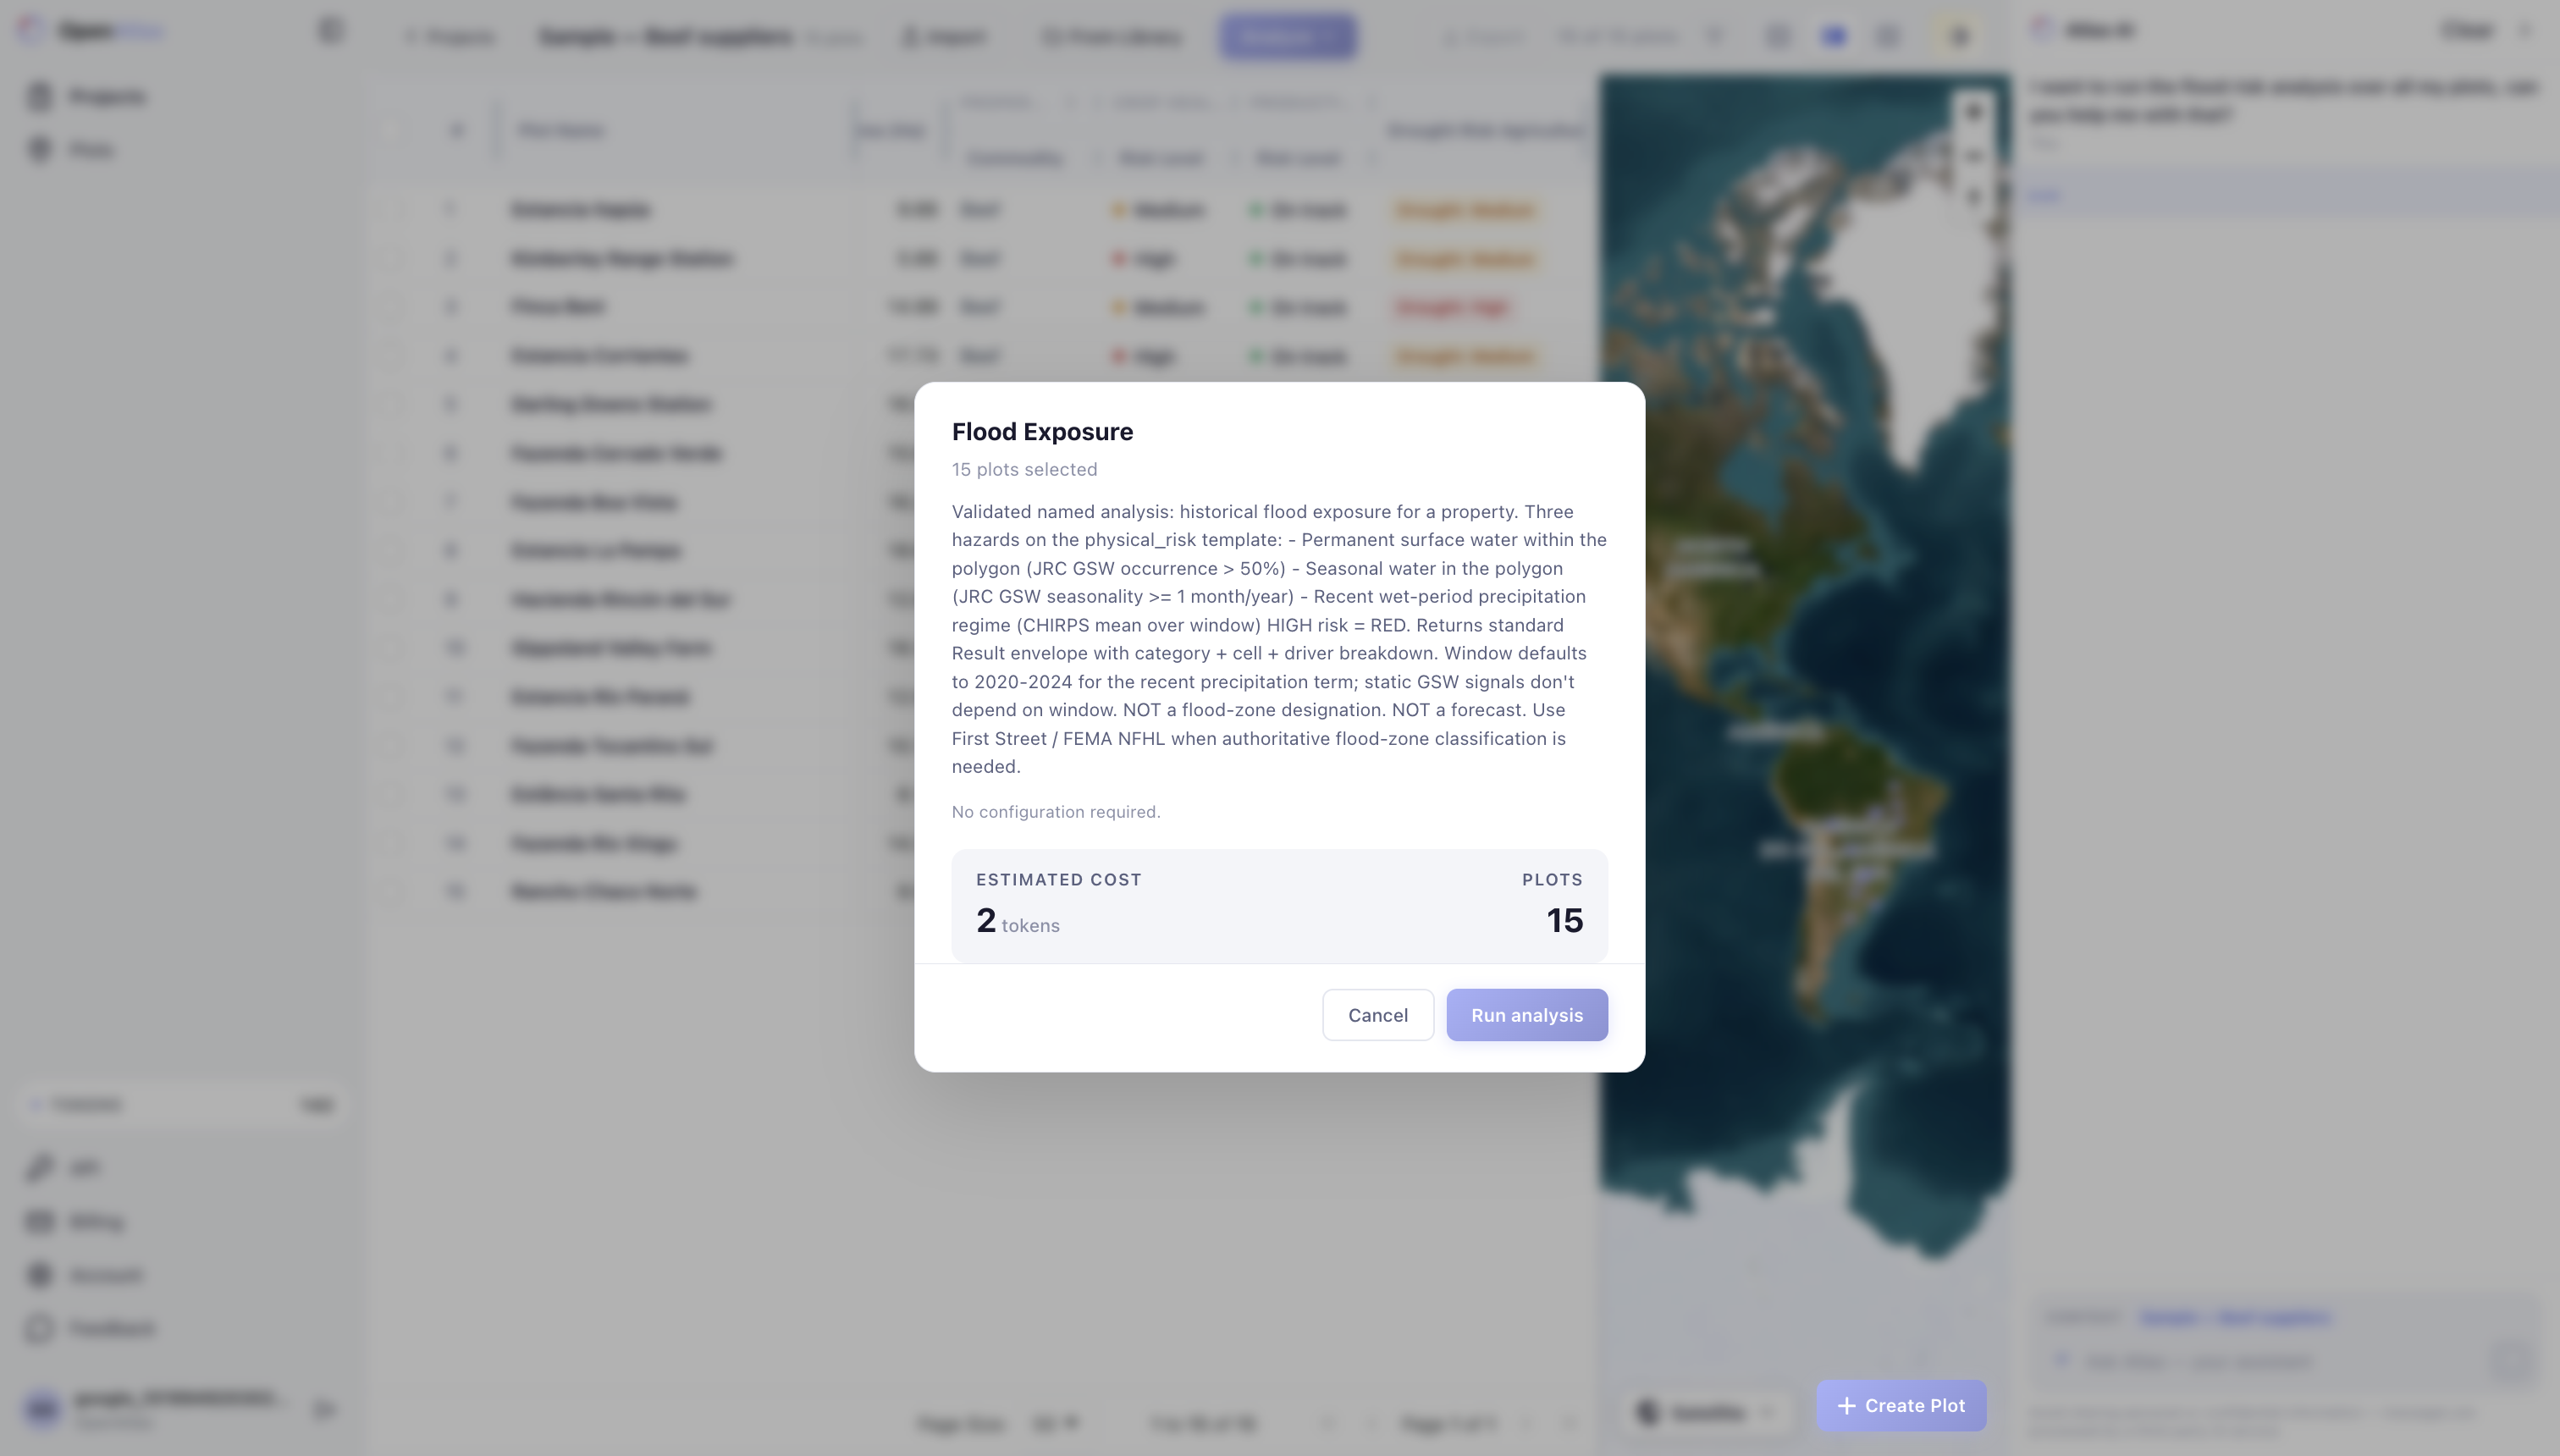
After Atlas starts the analysis, results populate in the project table the same way as manually started jobs. The assistant panel keeps the request context visible while the selected analysis runs.
Review results
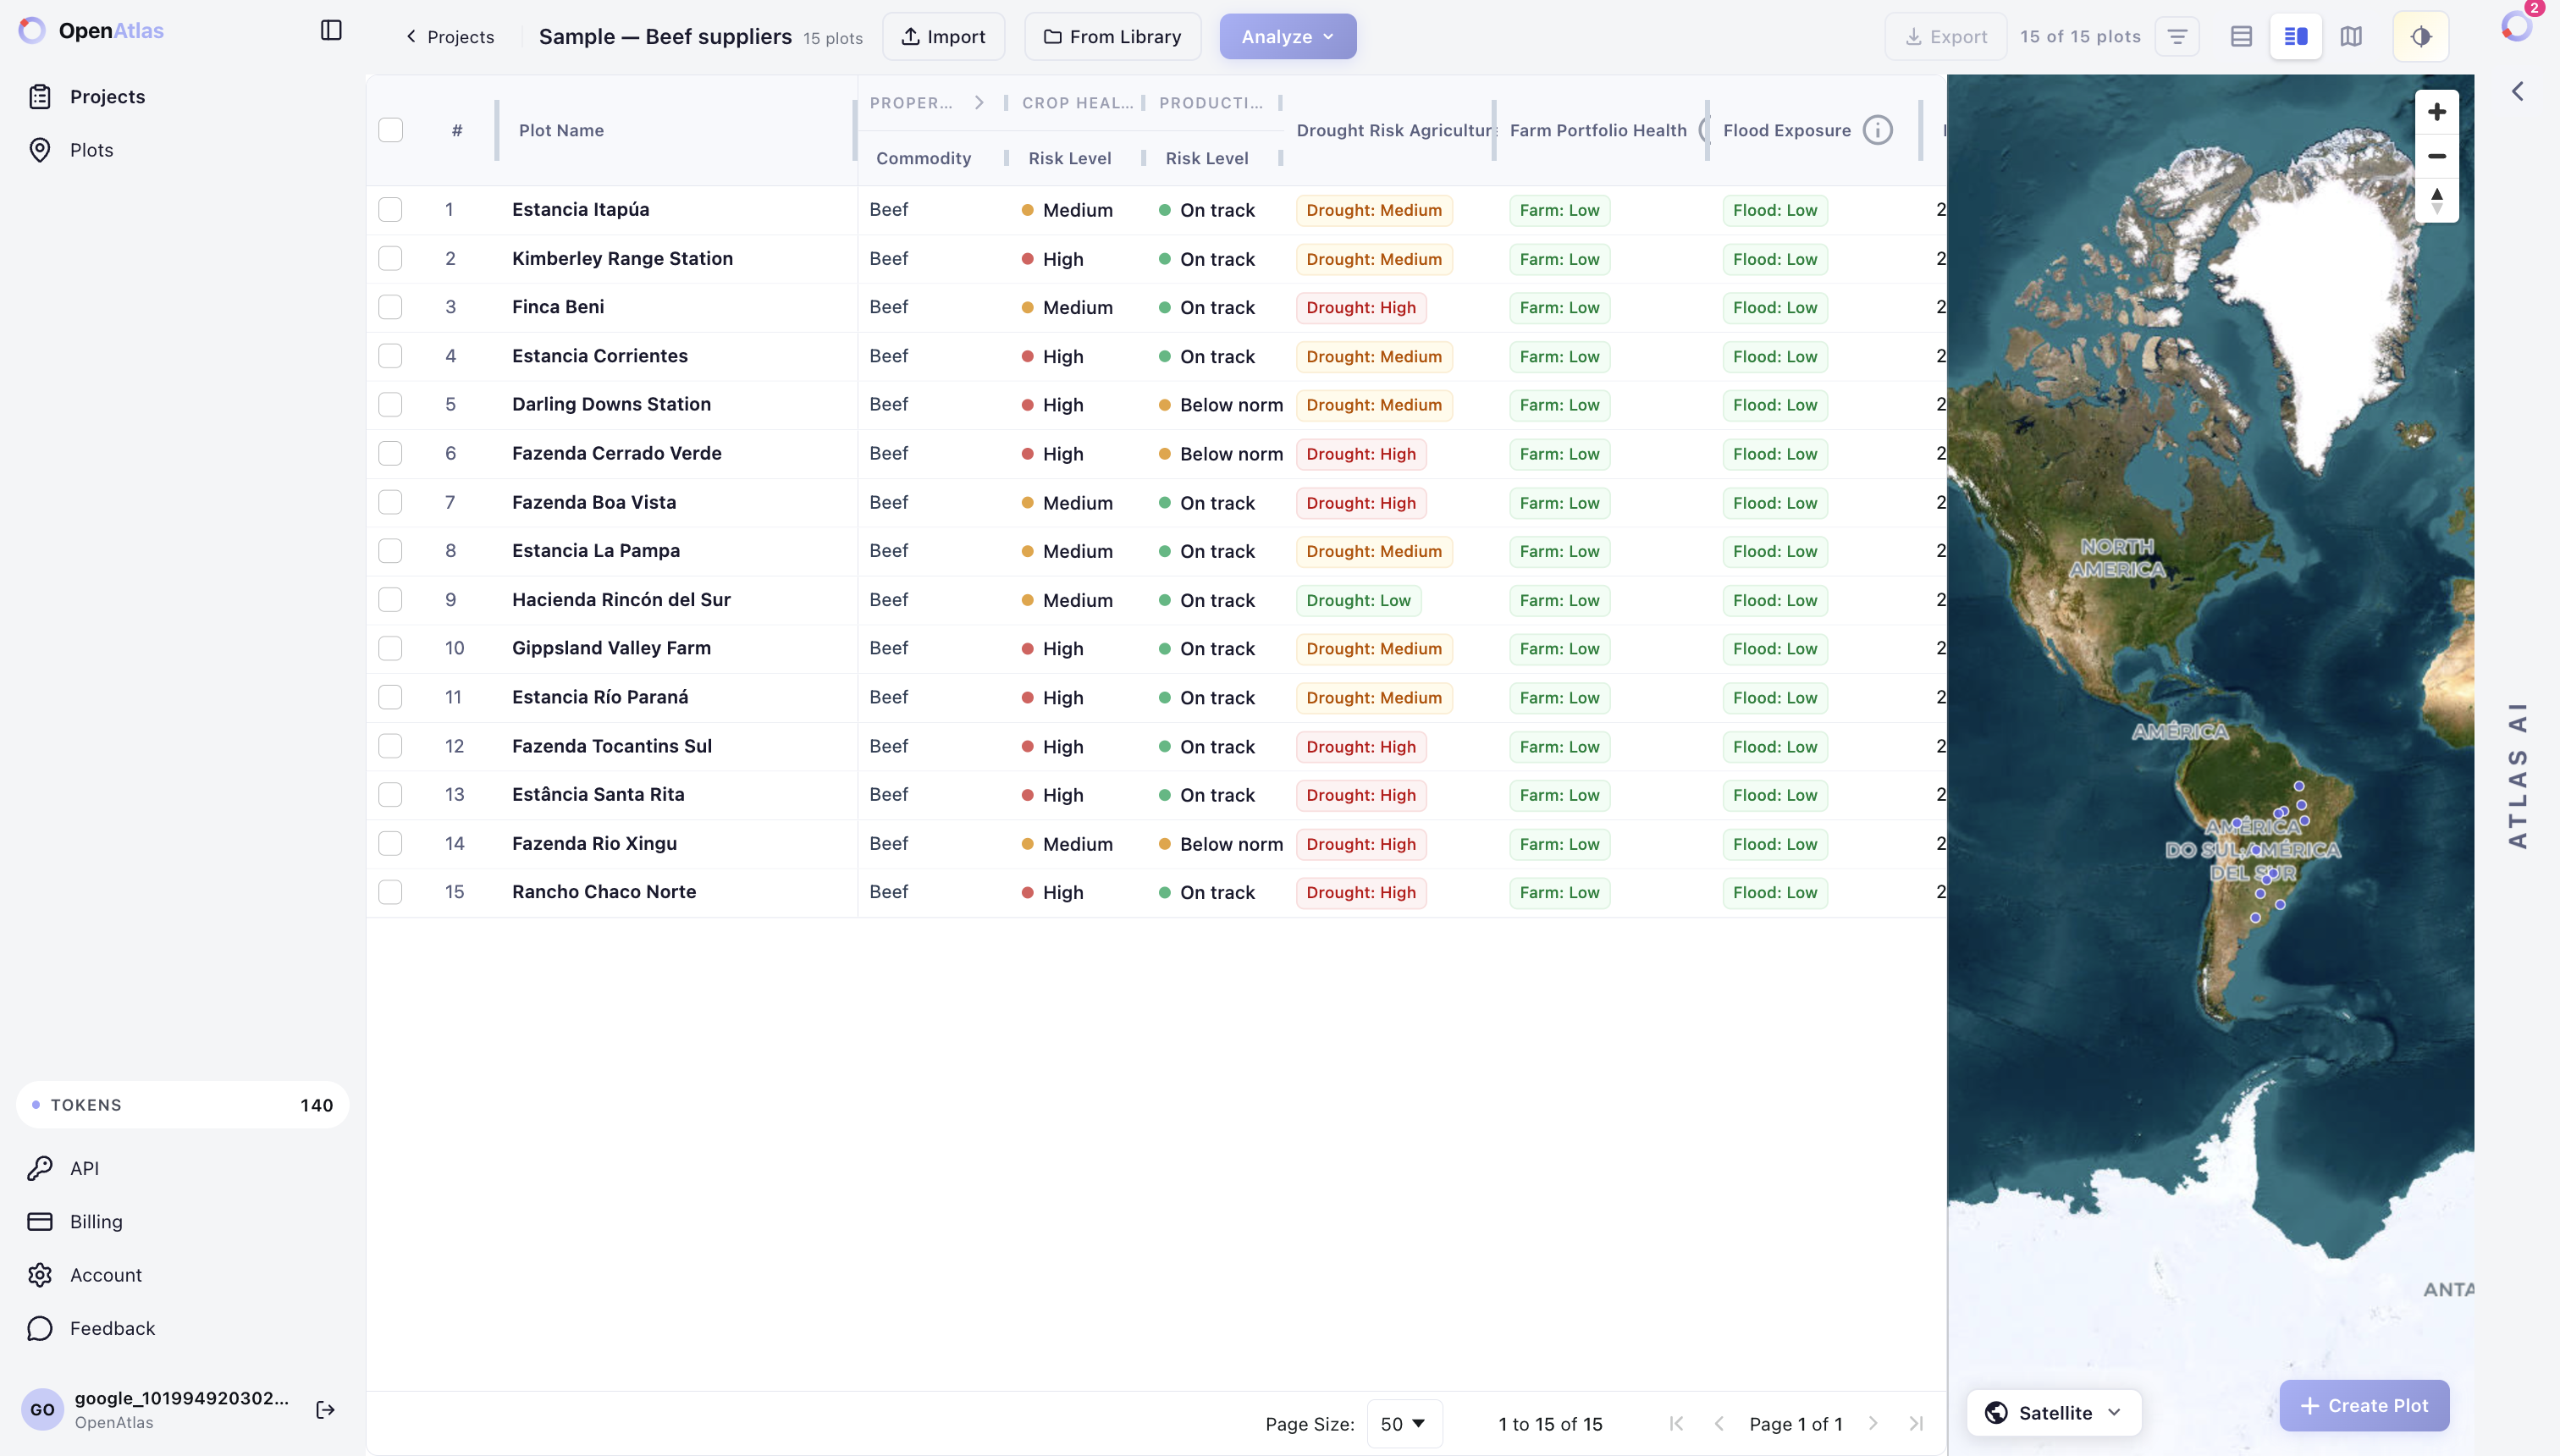
Results appear in the project table, map, and plot detail views. Depending on the selected analysis, results can include risk levels, status labels, overlap summaries, environmental signals, visual outputs, and report artifacts.
Use table columns for portfolio-level scanning and detail views for plot-level review.
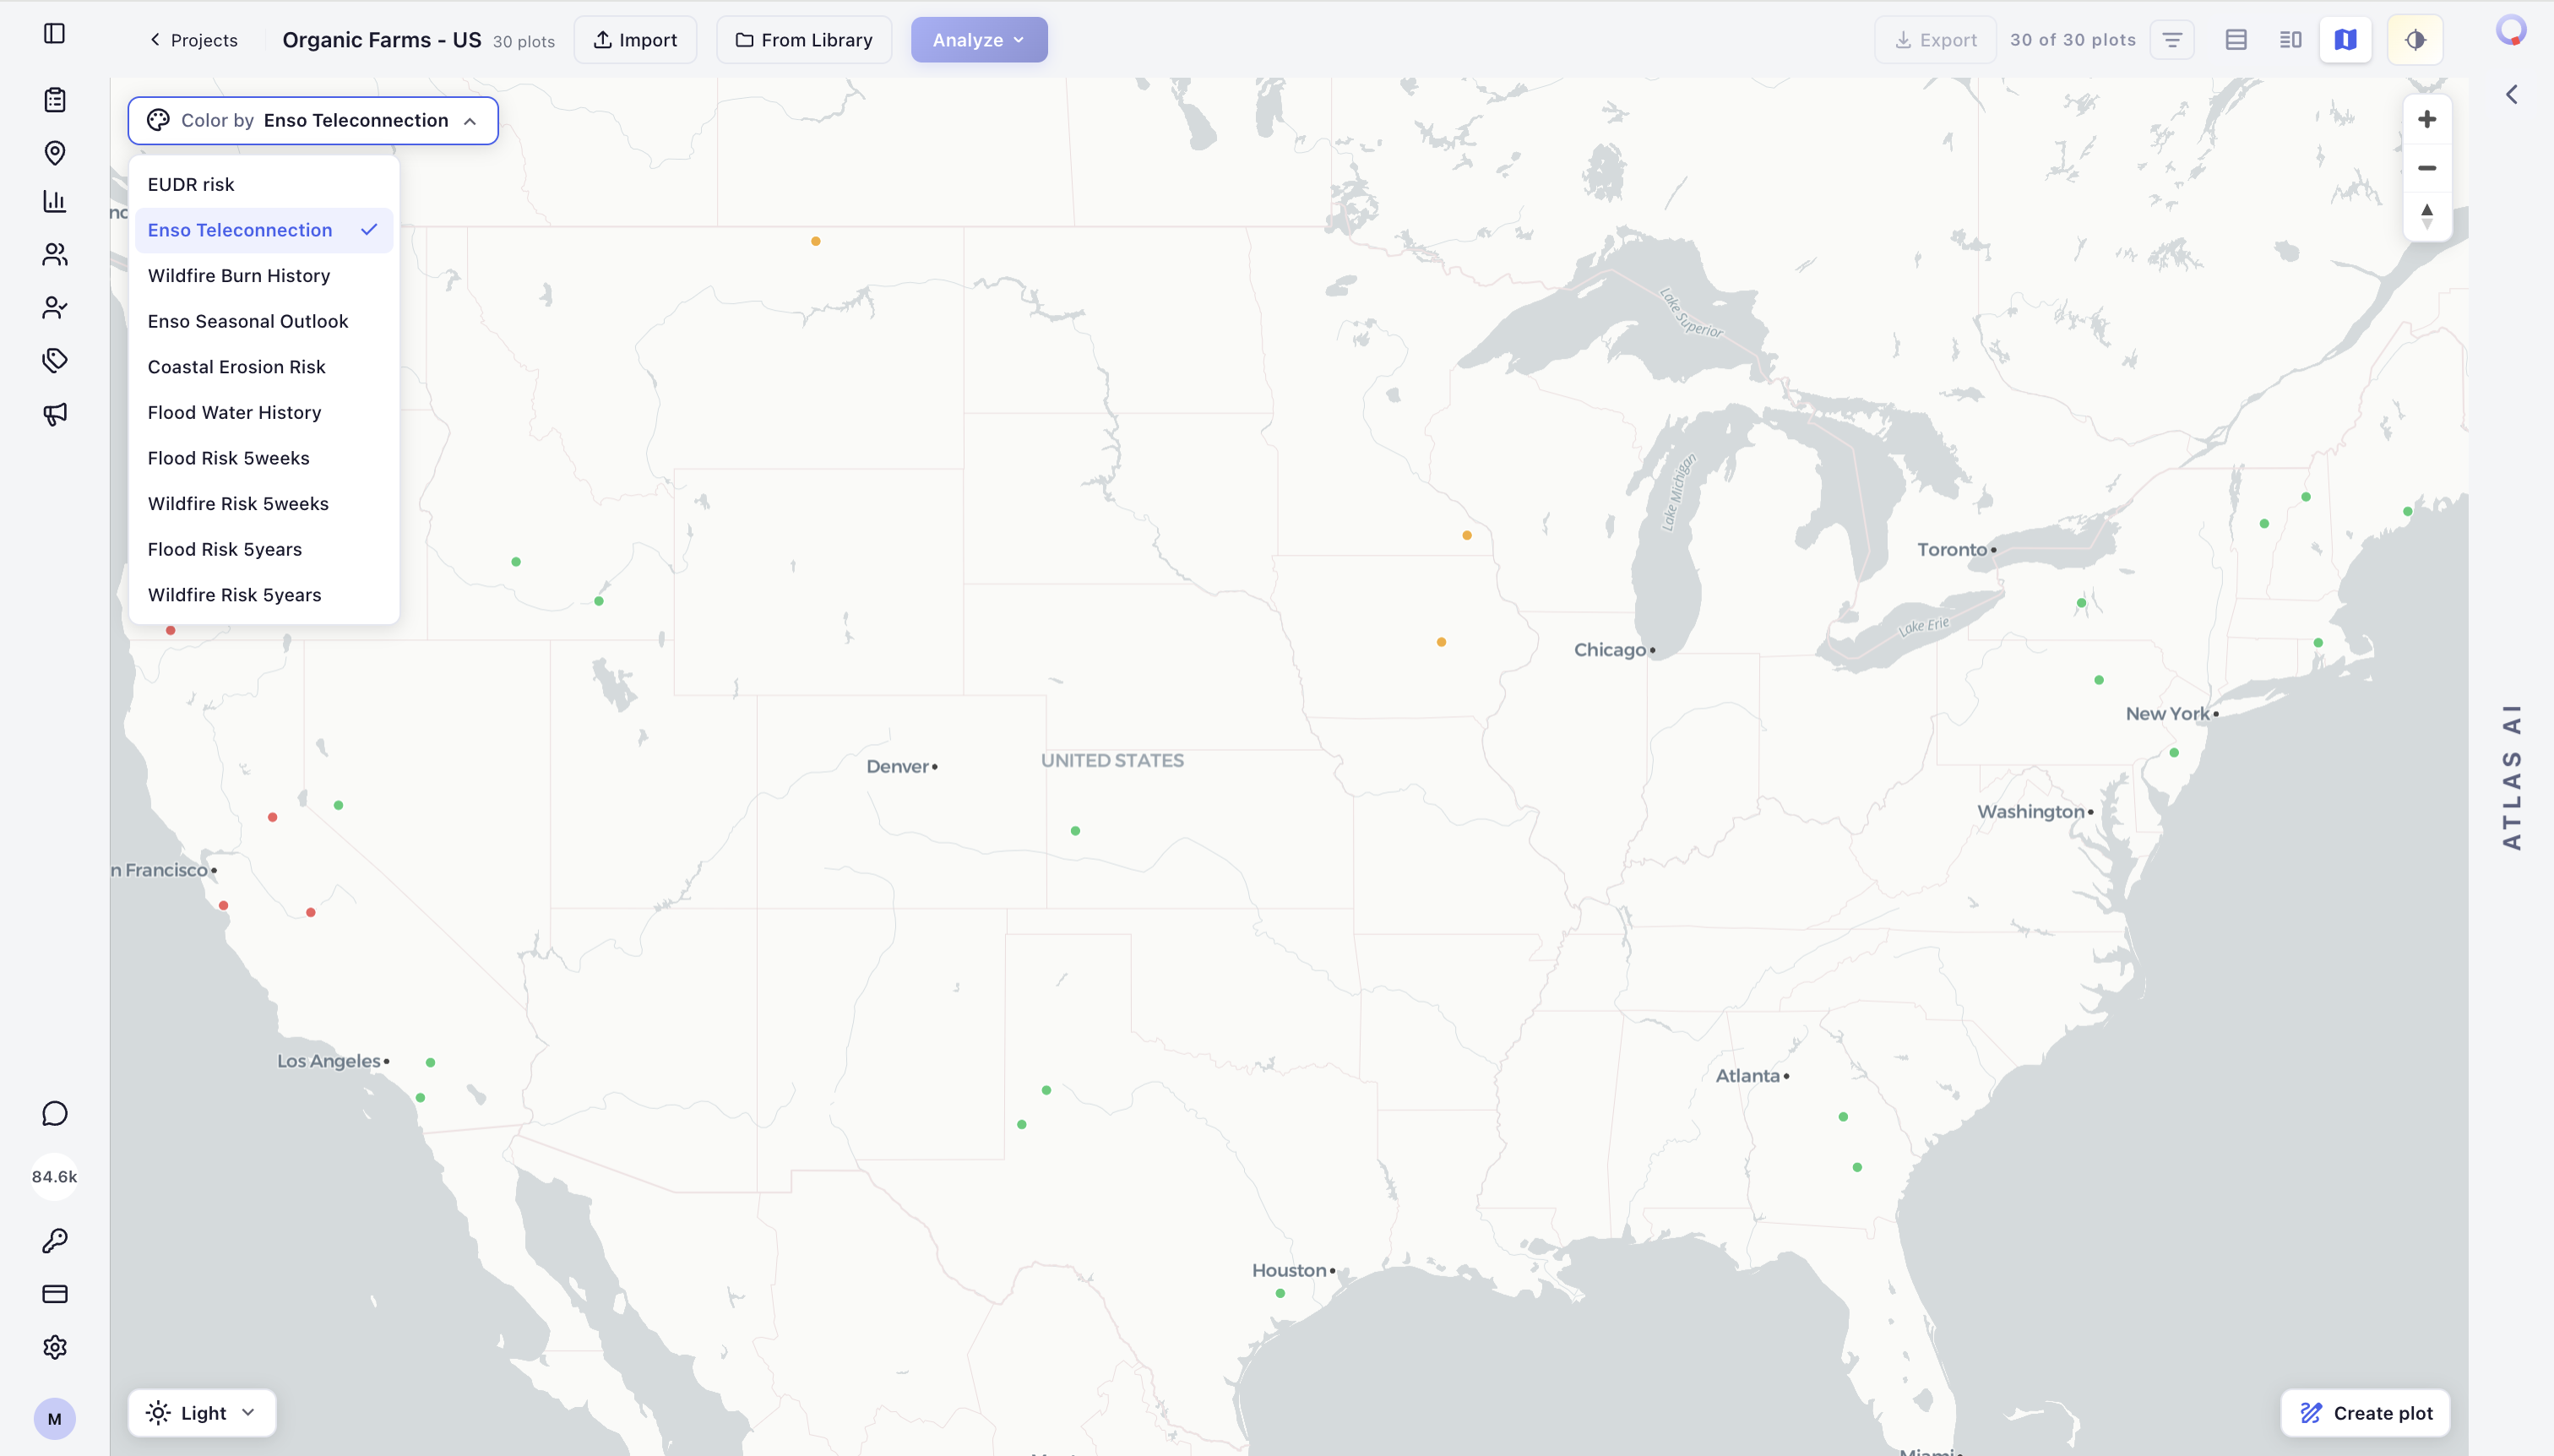
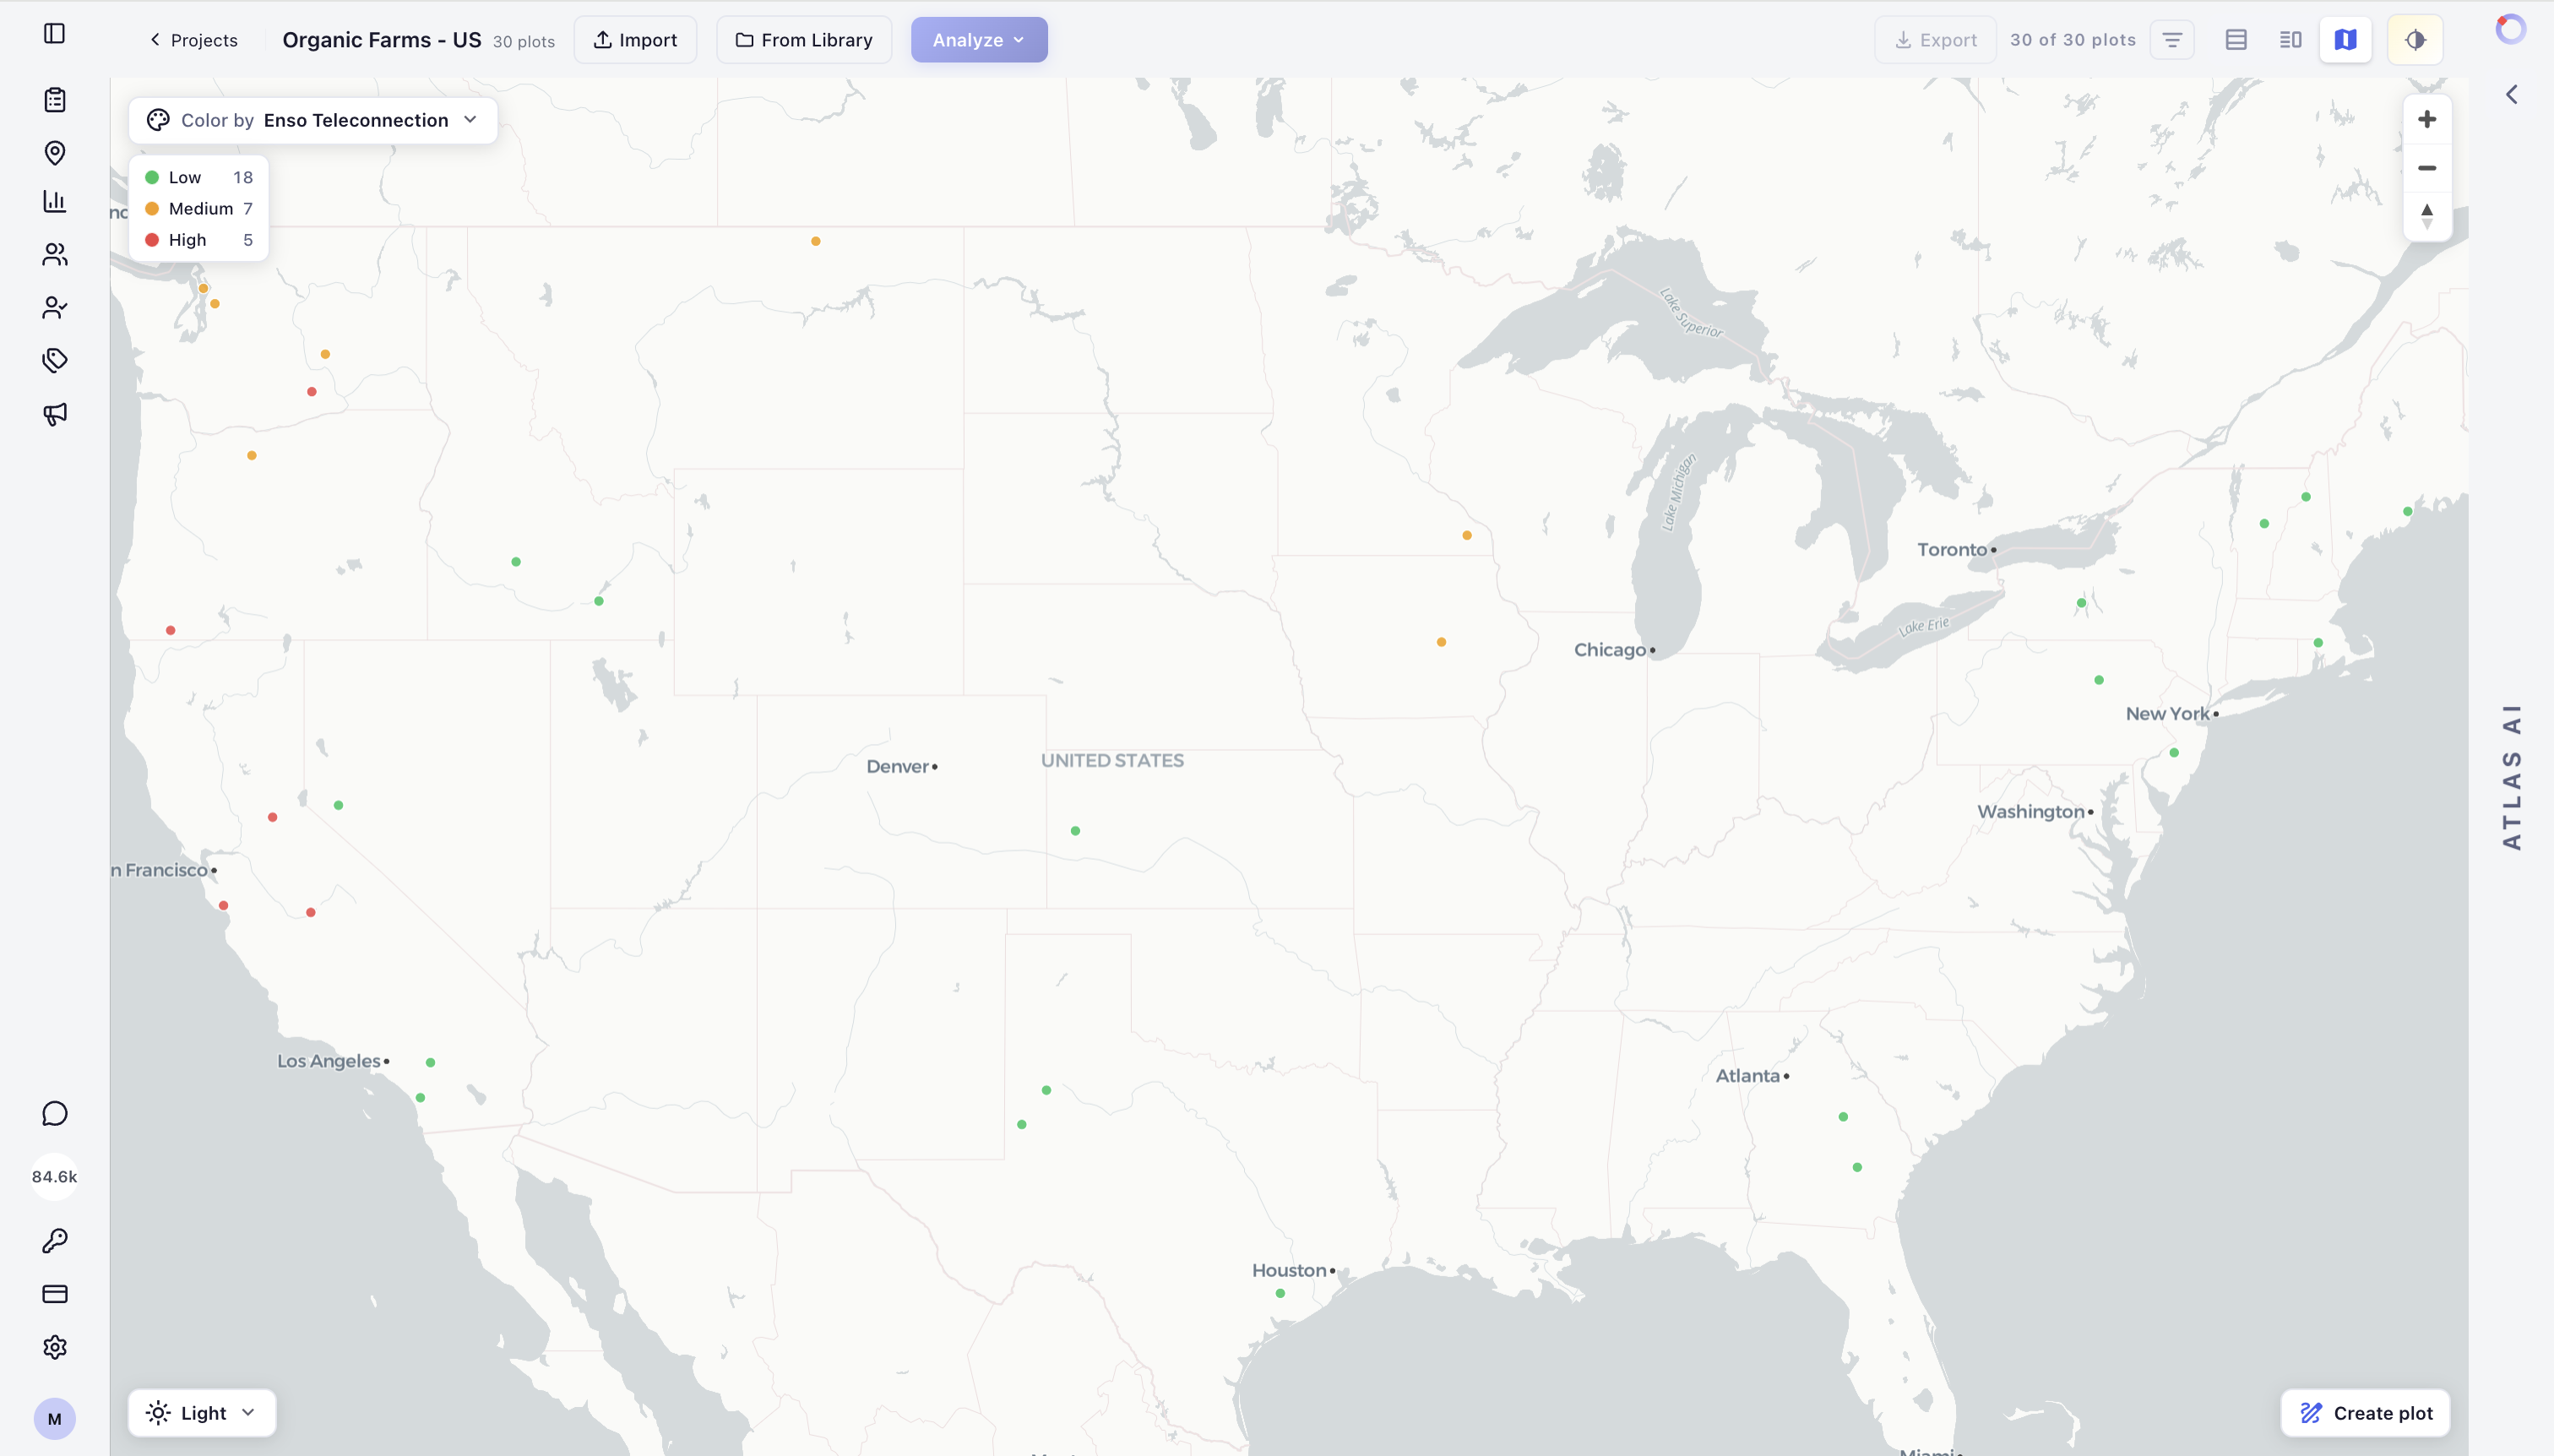
On the map, use Color by to select an analysis and group plots by its result categories. This works with Geospatial Analysis results as well as EUDR, so you can review different analysis types without changing the project or rerunning the analysis.
Export data
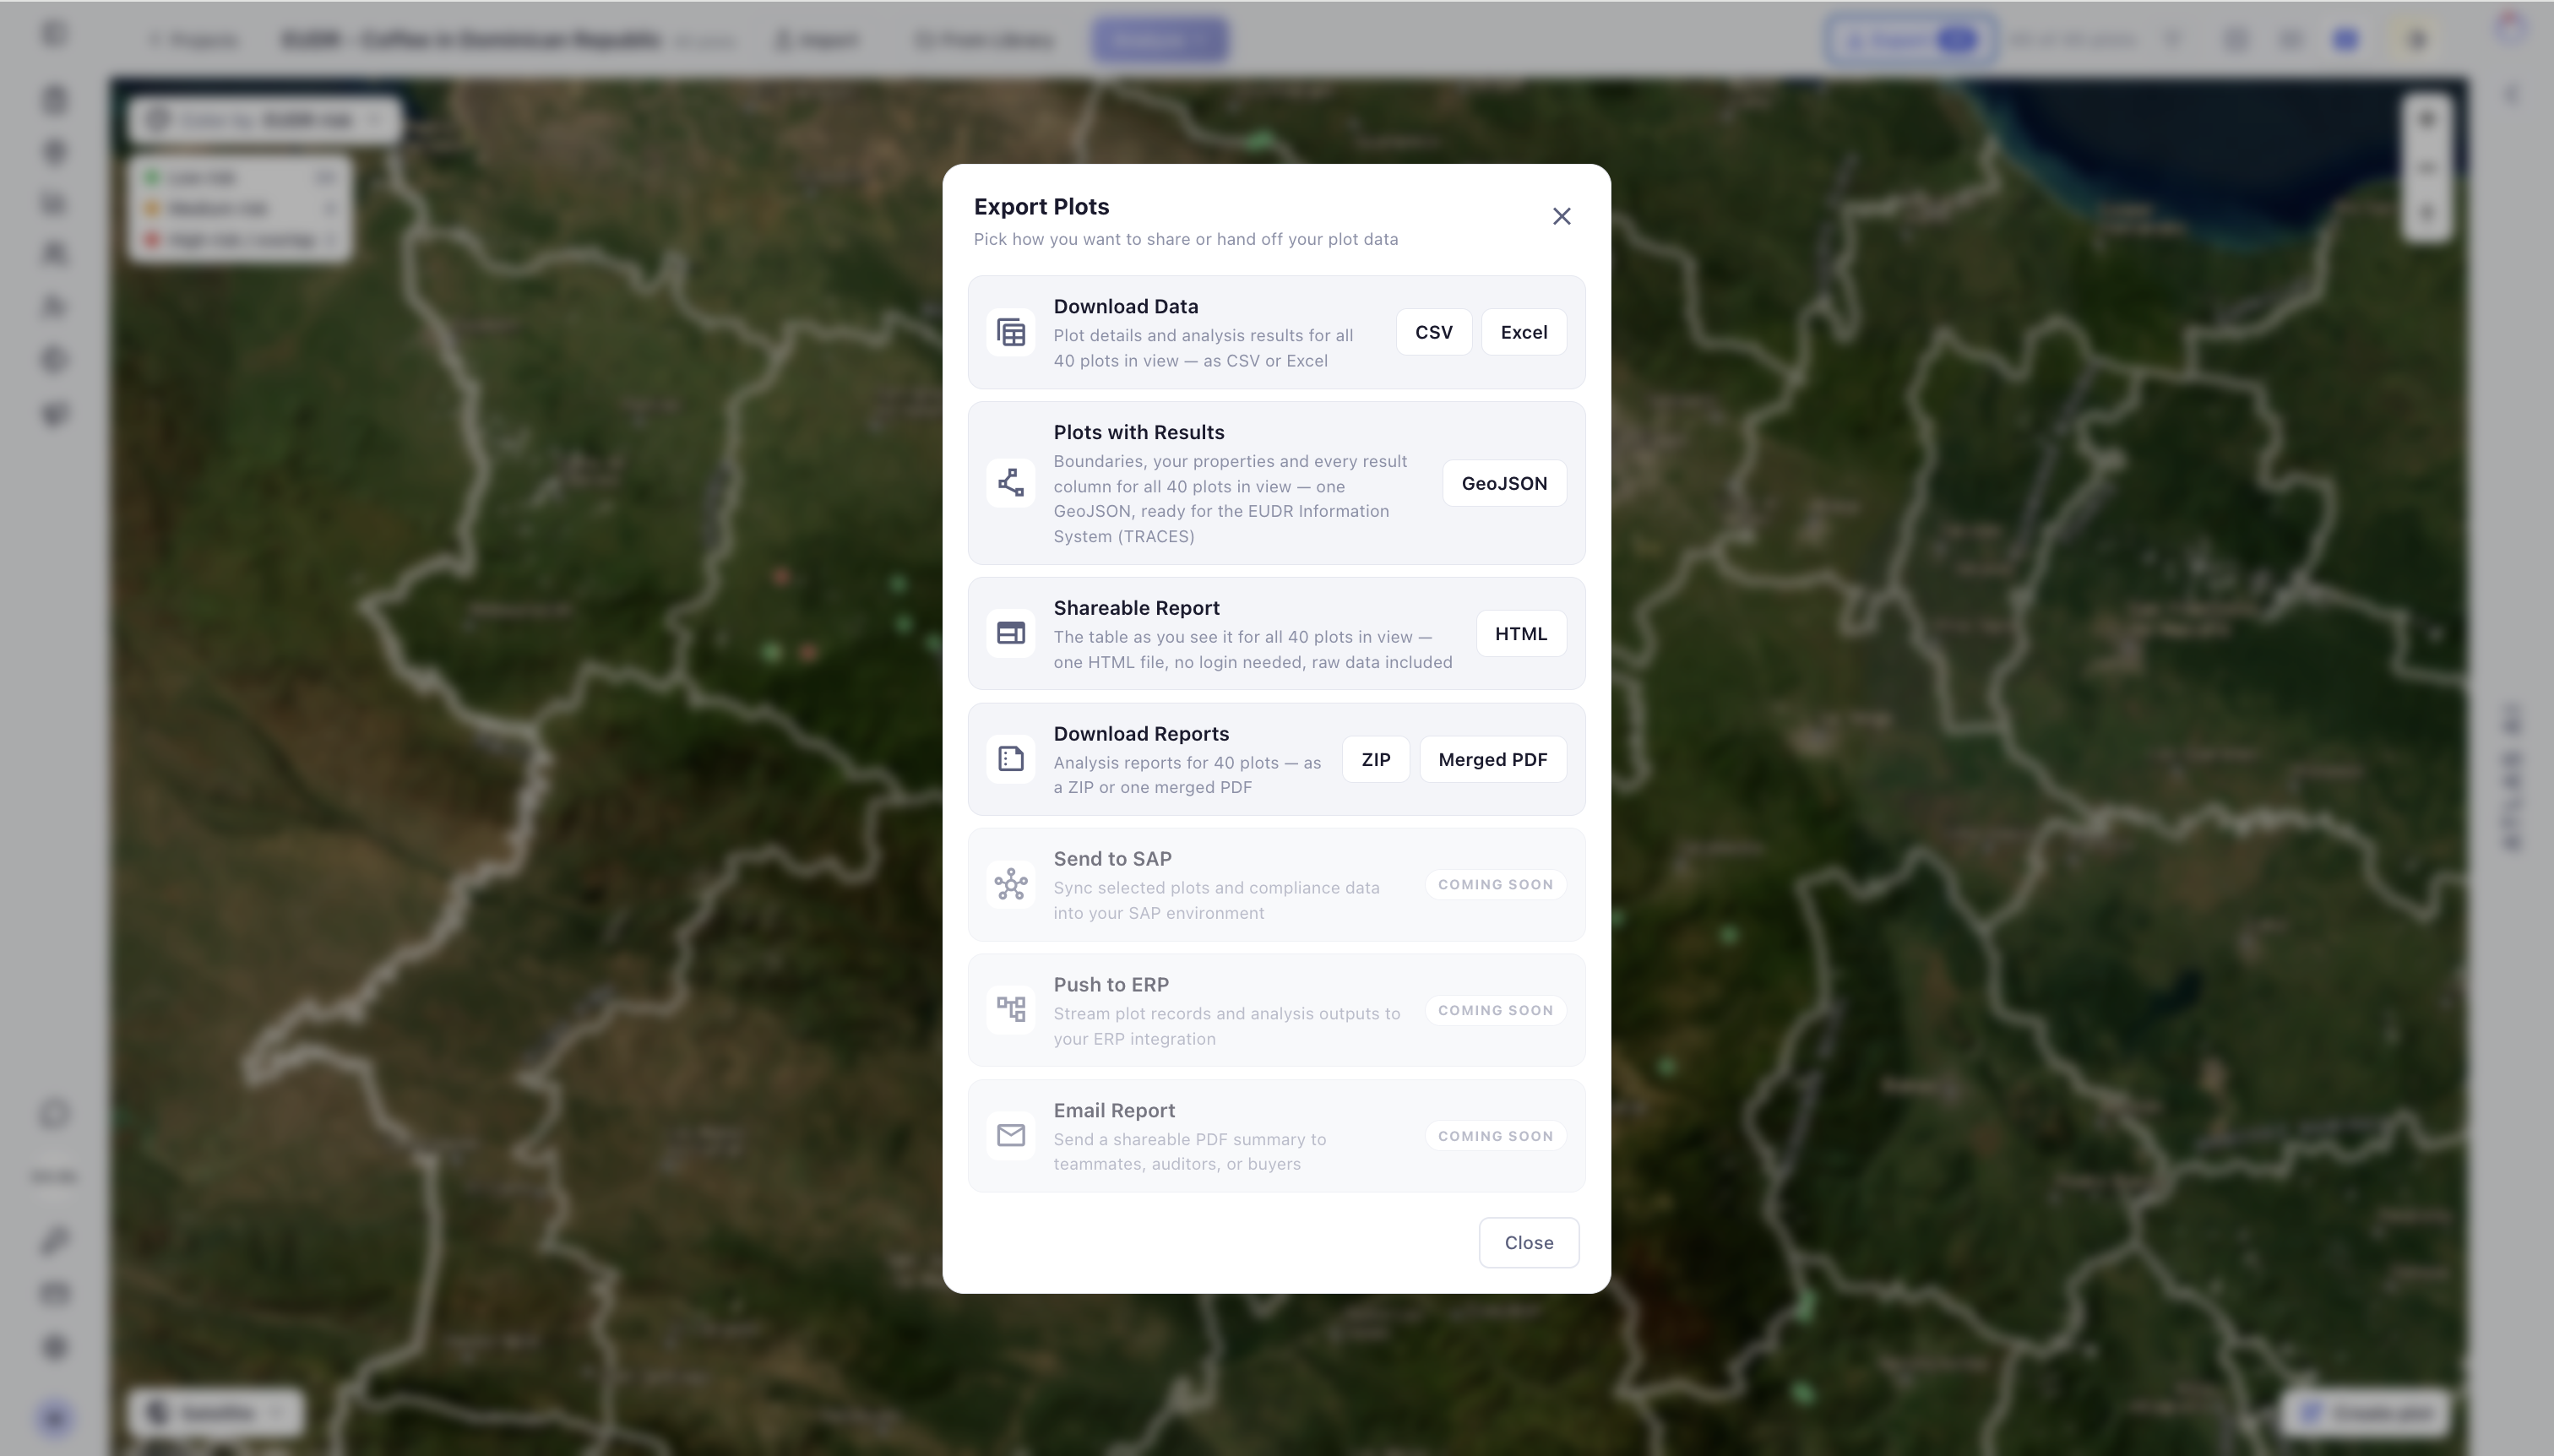
Use Export to download or share plot and analysis outputs. Export options can include structured data downloads, report downloads, and future workflow integrations. To export plot boundaries with their properties and analysis results, choose Plots with Results and then GeoJSON. The GeoJSON export can include selected plots or all plots, depending on the export scope, and can be used for downstream review or EUDR Information System workflows.
Continue in the API
The same core workflow can be automated with the Vantage API. See the Vantage API Tutorial for plot registration, EUDR and Geospatial Analysis jobs, result retrieval, and standalone Protected Areas checks.